


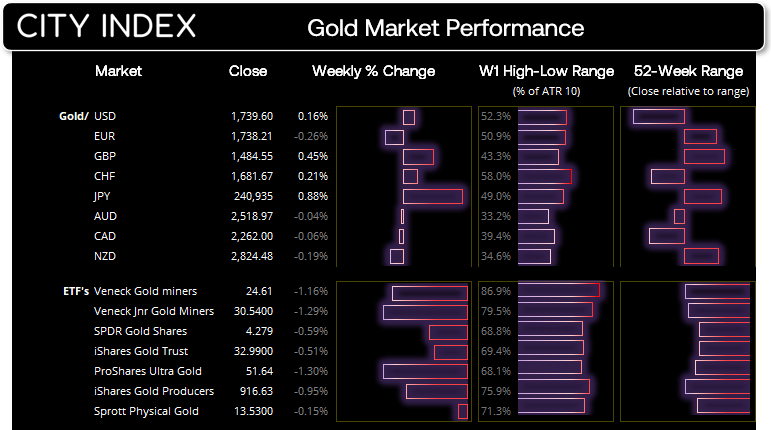


- The US dollar index rally is stalling just below the 2002 high
- Gold has closed lower for four consecutive weeks (and currently in track for a fifth)
- Bearish volatility for gold pairs is subsiding
- The gold basket (vs FX majors) is showing signs of a potential base
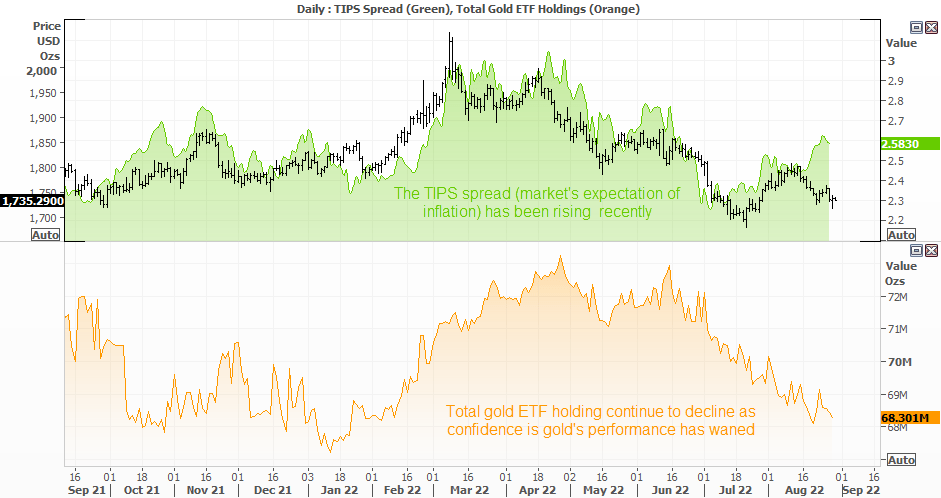
- The TIPS spread is rising, and that can lead gold prices
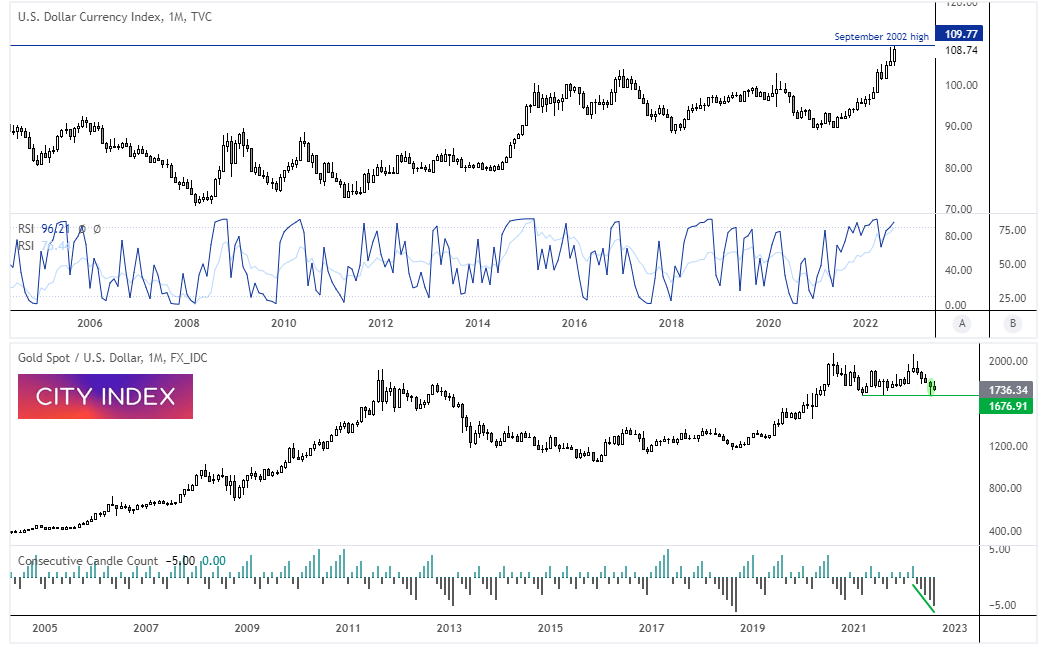
It’s been a tough few months for gold bugs, with the yellow having fallen for four consecutive months - and less than two trading days from its fifth. But perhaps that is a sign that it is due some mean reversion, or for its pace of selling to at least recede. A quick glance at the ‘consecutive candle count’ indicator shows that such sequences don’t appear too often, so we could be approaching an ‘up’ month. 1676 has so far proven to be a reliable support level since 2021, with last month’s candle forming a bullish hammer. And another glimmer of hope for gold bugs could be that the US dollar index (DXY) rally has stalled just below the September 2002 high.
Another reason to be wary of shorting gold is that the TIPS spread is rising. The TIPS spread is the difference between US treasury bonds and TIPS (which provides protection against inflation) and is considered to be the market’s perception of inflation expectations. The TIPS spread formed a low on July 6th ahead of gold’s low on the 21st. The lower panel shows that gold ETF holdings has continued to decline whilst gold prices have underperformed, but we can also see its direction lags behind gold – so I prefer to pay more attention to the TIPS spread for gold’s potential direction.
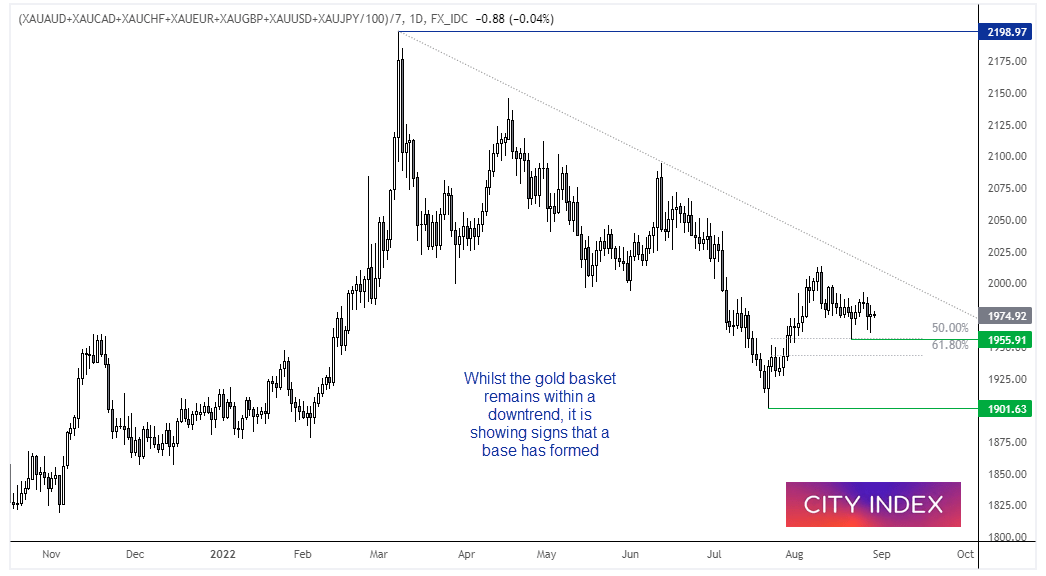
The gold basket is showing signs of a potential base
If we look at gold against a basket of currencies (such as FX majors) it can help to decipher whether gold is rising or falling due to its own strength or weakness. The daily chart shows that it remains within a downtrend – which itself is suspected to be a retracement against a larger uptrend – but it is showing signs of a potential base around the 50% retracement level. So we’re no on guard for gold prices to begin moving higher against all currencies, and not just the US dollar.
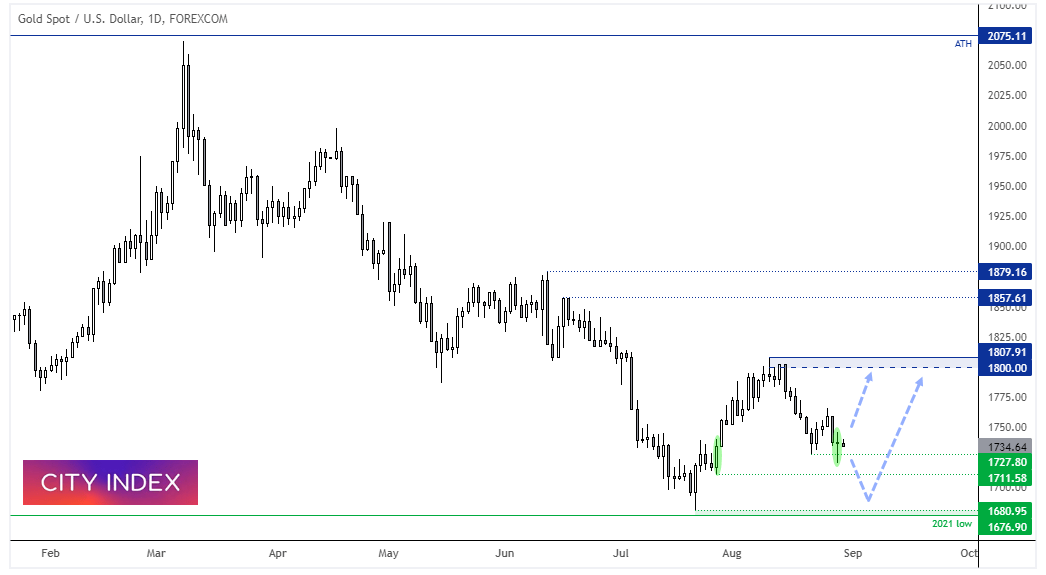
Spot gold daily chart:
Overall, I suspect the downside for gold may be limited. As noted above, 1767 (the 2021 low) has provided support since 2021 and any movement towards it may prompt buyers to step back in and support the market. Even if prices continue lower, the potential reward to risk ratio for bears seems inadequate with 1700 nearby.
A small Doji candle formed yesterday which shows a reluctance for the market to move lower, despite a large bearish session on Friday, Also note that a bullish engulfing candle formed in late July to show potential support at 1711, so we’re now on guard for evidence of a swing low to form as part of a countertrend rally. Although we may need to see more evidence of a swing high on the US dollar index, which formed a bearish Pinbar below the September 2002 high yesterday.
How to trade with City Index
You can easily trade with City Index by using these four easy steps:
-
Open an account, or log in if you’re already a customer
• Open an account in the UK
• Open an account in Australia
• Open an account in Singapore
- Search for the company you want to trade in our award-winning platform
- Choose your position and size, and your stop and limit levels
- Place the trade
Latest market news
Yesterday 03:00 PM
Yesterday 01:12 PM
Yesterday 11:14 AM
Yesterday 08:28 AM
April 24, 2024 03:30 PM
Latest XAU USD articles
February 20, 2024 10:27 PM
February 17, 2024 02:00 AM
February 14, 2024 07:30 PM
February 13, 2024 05:47 PM