


- DAX analysis: German index drops to test key technical support area
- Wall Street spooked by inflation data, further raising doubts over rate cuts
- Earnings from Microsoft and Alphabet to come after the bell
At the time of writing, the major indices were near their session lows, trying to rebound from key technical levels ahead of major tech earnings. European markets were trading mixed earlier with the FTSE holding near a record high, as shares in Anglo American surged on a buyout offer from BHP and as the market cheered earnings from Barclays and Unilever. However, the more tech-heavy German DAX slumped along with the US markets after the core PCE deflator rose 3.7% at an annualised rate in Q1, which was stronger than expected. Traders fear that this is the latest inflation data arguing against early rate cuts. As a result, we saw bond yields surge higher and even gold fell back momentarily. But after the big rally we saw earlier this week, the dips could be bought in the stock markets as today’s data releases do not change anything materially. The focus will also remain on earnings with more tech giants due to post their results after the close. Bearish traders may therefore choose to stand out of the way, which could alleviate pressure on the markets.
Before discussing why the markets dropped, let’s have a look at the DAX chart which was testing a pivotal zone at the time of writing…
DAX analysis: German index tests key technical support area
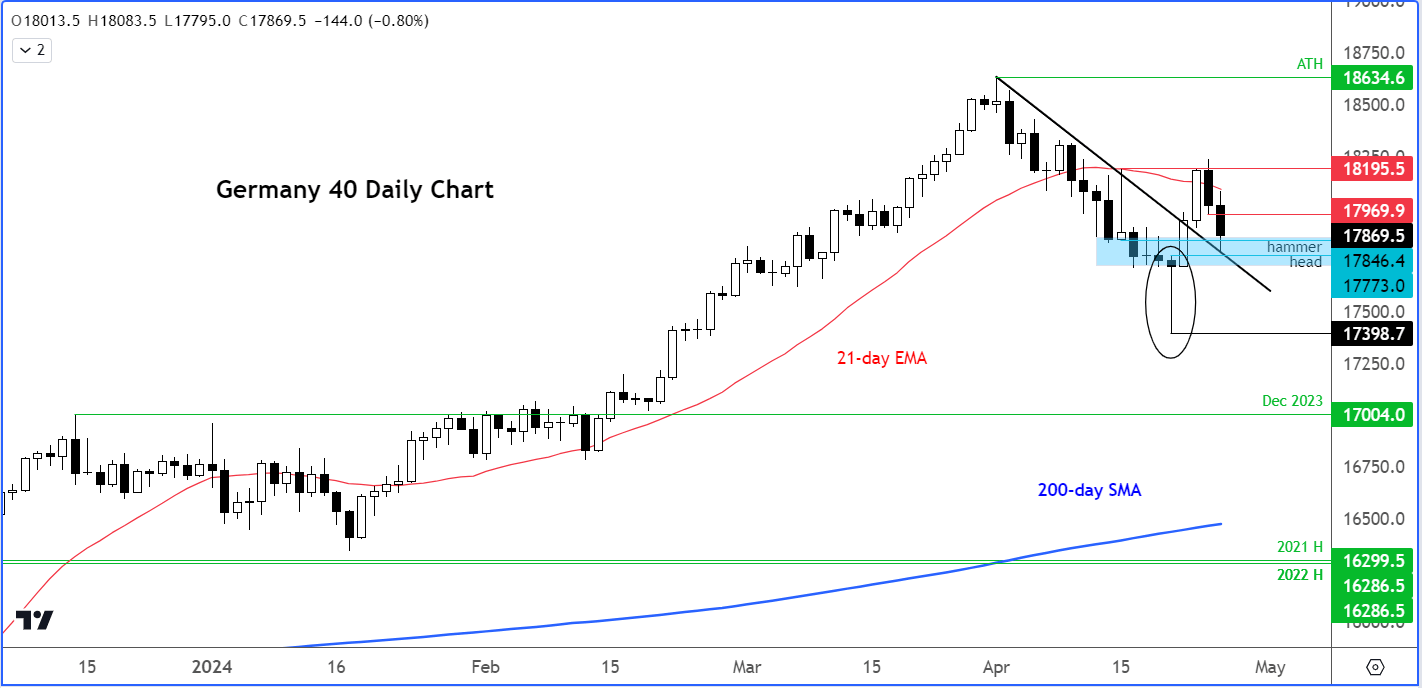
Source: TradingView.com
Following its big rally earlier this week, driven in part by SAP’s earnings results, the DAX broke above its bearish trend line that had kept the index under pressure since hitting a record high earlier this month. But on Friday we saw the index surge higher from its earlier lows to form a nice hammer candle. That was followed by further technical buying at the start of this week, before the ongoing macro concerns caused the markets to drop again.
The DAX was now testing the backside of that broken bearish trend line and key former short-term resistance around the 17770-17850 area. The head of Friday’s hammer candle is within this range, where we have seen lots of price action in the last couple of weeks. This is now going to be the most important short-term support range to watch.
Following the powerful recovery earlier this week, I wouldn’t be surprised to see the DAX stage a bounce from here. Whether or not that potential bounce then manifests into a full-on rally remains to be seen and will depend to some degree on the upcoming earnings results from Microsoft and Alphabet tonight, which could shape sentiment towards the tech sector.
Short-term resistance is now seen around 17970, marking the low from Wednesday’s bearish candle. A potential move above that area could pave the way for another run at last week’s high of 18195 and potentially higher.
However, if the abovementioned support area between 17770 to 17850 gives way on a closing basis, then watch out below.

DAX analysis: EU stocks decline further after Wall Street spooked by inflation data
The GDP deflator could spook the Fed and prevent it from cutting rates this year, is what caused the earlier selling on Wall Street, and to a lesser degree in Europe.
Shares on Wall Street were shaken by data that revealed precisely the news stock traders were hoping to avoid. There was a marked deceleration in growth at the world’s largest economy, while simultaneously more evidence of sticky inflation emerged from the GDP deflator. The latest economic data has compounded fears of stagflation and has intensified uncertainty regarding the trajectory of Fed’s monetary policy. Consequently, traders pushed back their rate cut expectations further out, and now see the first cut near the end of the month. This caused Treasury’s to extend their falls, sending yields higher with the two-year yields now above 5%.
-- Written by Fawad Razaqzada, Market Analyst
Follow Fawad on Twitter @Trader_F_R
How to trade with City Index
You can trade with City Index by following these four easy steps:
-
Open an account, or log in if you’re already a customer
• Open an account in the UK
• Open an account in Australia
• Open an account in Singapore
- Search for the company you want to trade in our award-winning platform
- Choose your position and size, and your stop and limit levels
- Place the trade
Latest market news
Yesterday 01:32 PM
Yesterday 09:35 AM
Yesterday 07:23 AM
Yesterday 04:48 AM
Yesterday 12:17 AM
July 25, 2024 10:39 PM
Latest Dax articles

July 25, 2024 08:50 AM

July 17, 2024 08:26 AM
July 4, 2024 03:00 PM

July 3, 2024 08:27 AM