


US Dollar talking points
- The U.S. Dollar is trading at a fresh 2024 high after this morning’s CPI report. The current high for DXY is at the early-December swing low, in the 104.78-105.00 zone.
- The big question now is whether USD bulls can continue the push and for that, EUR/USD bears would likely need to push deeper towards longer-term range support. Also of note is the fact that USD/JPY has pushed back-above 150.00 which has helped to hold the highs for each of the past two years. And spot gold is showing its first test below the $2,000 psychological level since the December FOMC rate decision.
- I’ll be discussing these themes in-depth in the weekly webinar. It’s free for all to register: Click here to register.
The U.S. Dollar is continuing what’s been a very strong start to 2024 trade, getting another extension in the move after this morning’s CPI report.
Both headline and core CPI printed above expectations, with core CPI remaining at 3.9%. This would make the case for starting rate cuts even more challenging when meshed with the earlier-month NFP report, which showed continued strength in labor market data. For a Fed that’s been telling markets that rate cuts are on the way, even during the hiking cycle, this complicates matters as core inflation remains far away from the Fed’s 2% target, depicted below with a red line on that data point going back to January of 2021.
While there was significant progress being seen on inflation in late-2022 and the first-half of 2023, core CPI has started to flatten, and this speaks to one of the Fed’s fears about inflation becoming ‘entrenched’ in the U.S. economy.
U.S. Core CPI
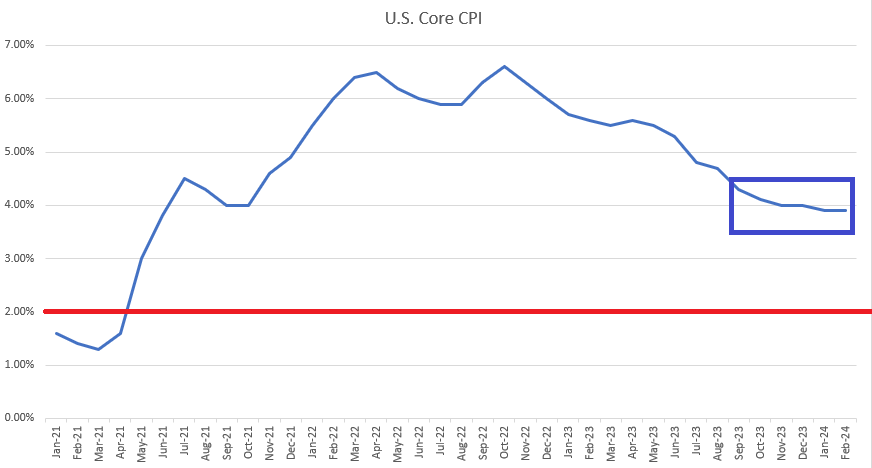
Chart prepared by James Stanley; data derived from Tradingview
The immediate impact after that report was a furtherance of some notable themes, namely in the pricing out of some rate cuts this year as longer-dated Treasury yields tipped higher.
The 10-year has seen yields jump to a fresh two-month high and there’s a test right now at a familiar spot on the chart. The 4.29-4.3% area was where yields had topped in October of 2022, just as hope was returning that the Fed would be able to soften their tightening strategy. That level became resistance again last August but that only held the cap on yields for a couple of weeks as the 10-year then continued to march up to the 500 bps level.
Today’s high of 4.3% is quite far away from the 3.82% that traded in the opening days of 2024, illustrating how quickly this theme has priced-in so far this year.
U.S. Treasury 10-Year Yields
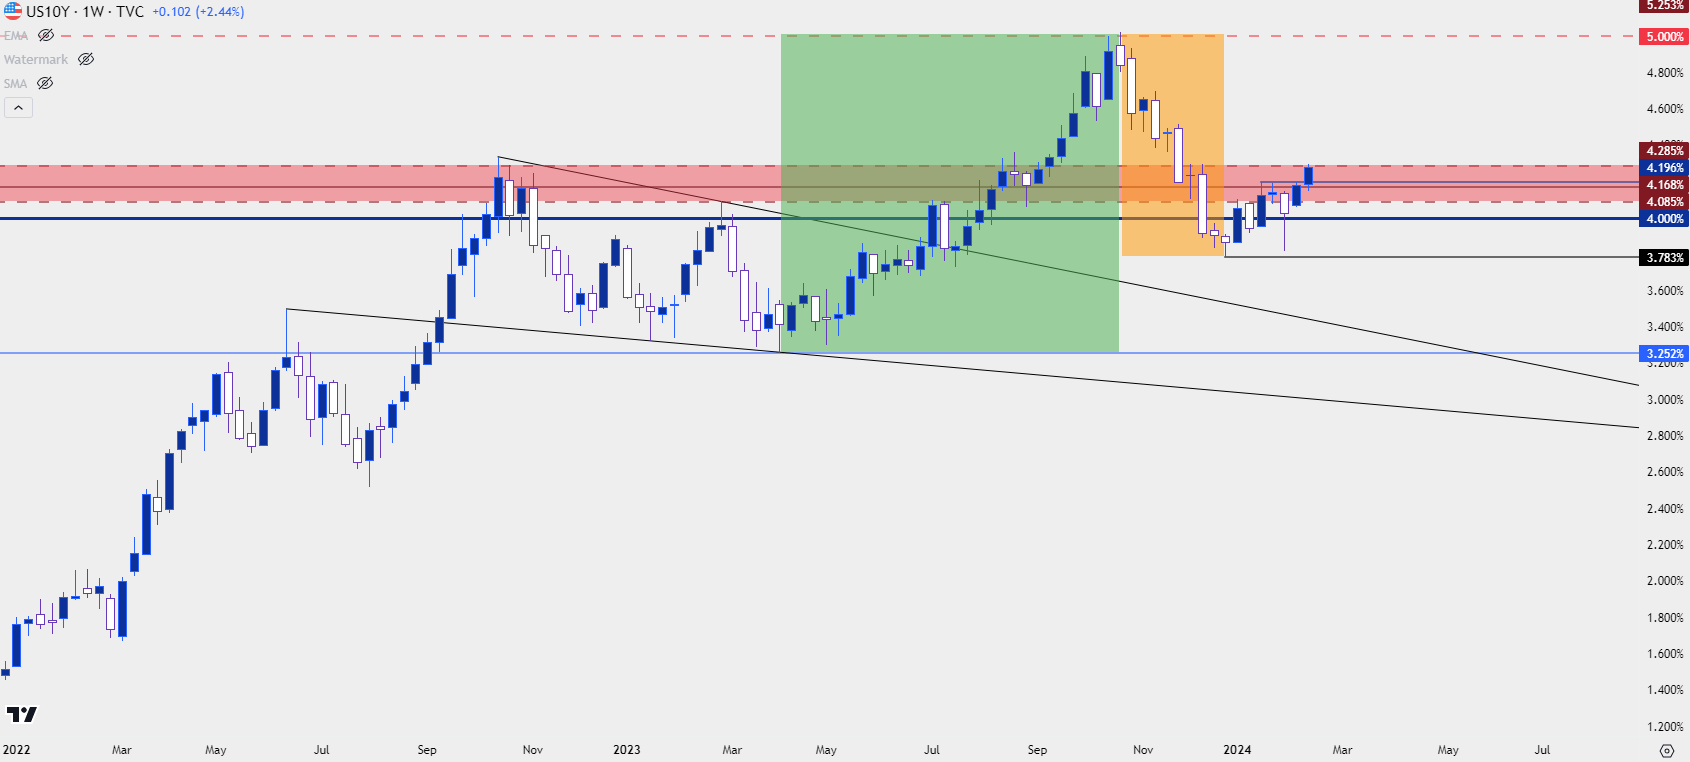 Chart prepared by James Stanley; data derived from Tradingview
The U.S. Dollar
The U.S. Dollar took a serious punch in the final two months of last year, and the Fed had a hand in the push as a bearish trend began at the rate decision on November 1st, and that theme of USD weakness largely lasted into the final few days of the year.
Making matters even more interesting – it’s not as if Europe was undergoing any profound economic revivals, nor was China. And as looked at in the U.S. Dollar background piece, DXY is merely a composite of underlying currencies. So, more important than just expectations around the Fed and how those are shifting, is how it compares to other central banks on a relative basis. The same argument that drove the USD-higher in the summer, in which European economic data was dimming while U.S. economic data remained a bit stronger, that still held for much of the period. But a heavy hand from a dovish Fed helped to push the USD down with markets expecting up to six 25 bp rate cuts this year.
But as we tread deeper into 2024 trade it becomes clear that the backdrop can’t quite support that level of dovishness. Employment remains strong per the unemployment rate that was just released at 3.7%. And inflation remains stubbornly high, which was illustrated in Average Hourly Earnings in that NFP report coming in at 4.5%, and echoed again this morning with Core CPI sticking at 3.9%. And then from the above chart of core CPI, you can see where the drawdown in that data point has slowed significantly over the past few months, begging the question of how its going to fall back-below 2% anytime soon.
Nonetheless, the Fed has remained dovish through much of this and it would be of little surprise to hear that continue, with focus on rate cuts starting at some point later in the year after the bank gets more evidence that inflation is softening, to some degree.
Any abrupt changes, such as beginning to factor in the possibility of another interest rate hike, would likely have to take place at an FOMC meeting and probably after even more strong data shows. For the U.S. Dollar, also of pertinence is when rate cuts in Europe may begin and any push of dovishness from the ECB could impact that expectation, thereby delivering more strength to the USD.
At this point, the U.S. Dollar has begun to re-test a key spot on the chart running from 104.78 up to 105.00. This zone was last in-play as support just after the November Fed meeting and it led to a bounce up to a lower-high that lasted for a little over a week; until a softer-than-expected CPI release excited markets that rate cuts may be closer than previously expected.
Now we re-test that same spot as that expectation gets further priced-out.
U.S. Dollar Daily Price Chart
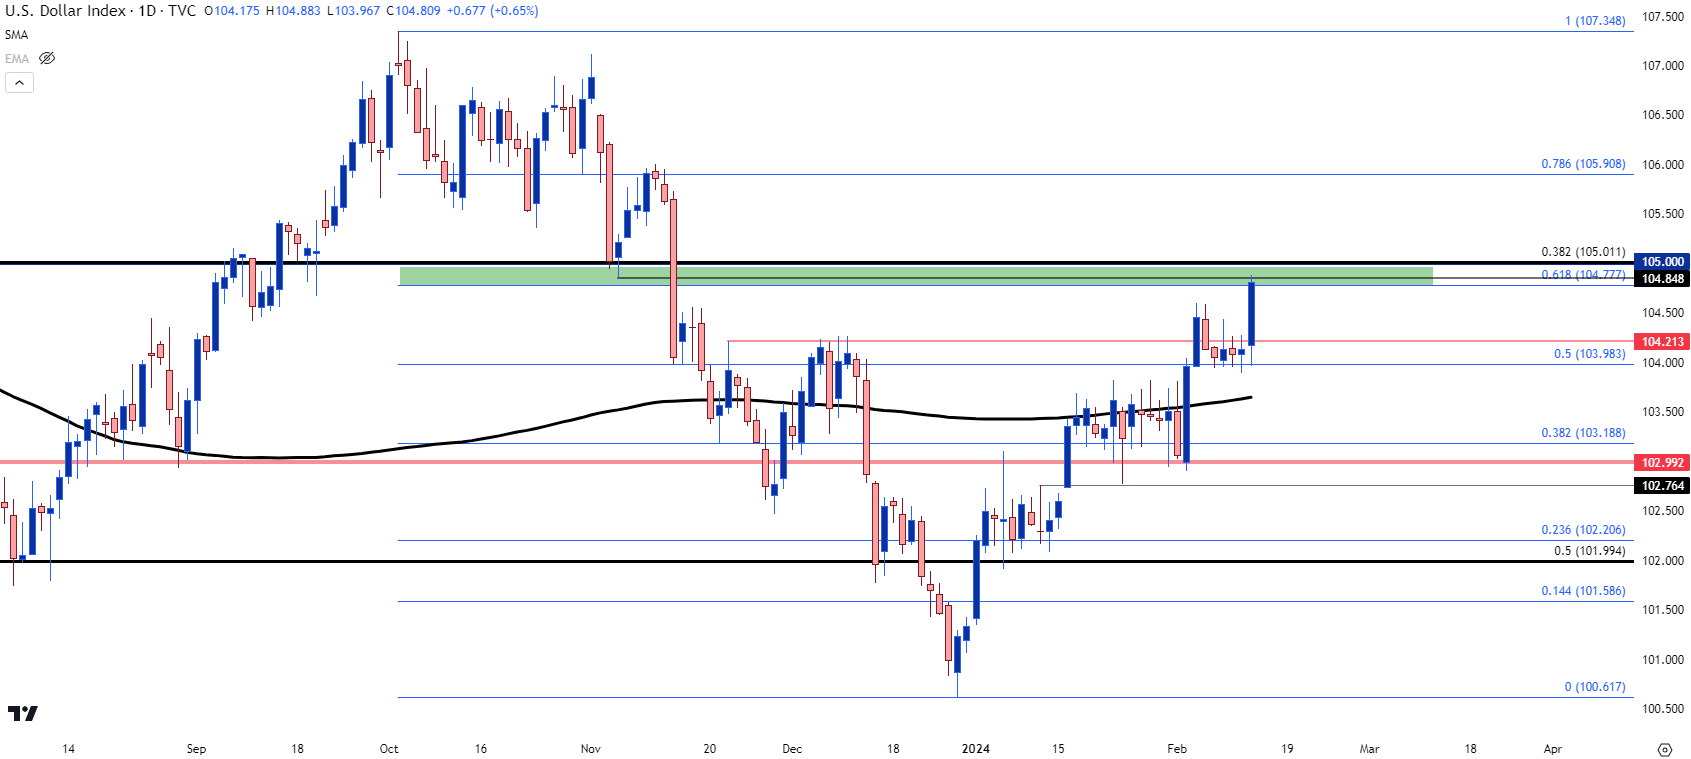 Chart prepared by James Stanley; data derived from Tradingview
USD Shorter-Term
I had looked into this in the webinar last week as the USD had just completed it’s strongest two-day rally in a year, and as I shared there, bulls’ response and where it showed would be key.
Given the almost three weeks of resistance at the 200-day moving average, that made sense as a spot of support, but the big question is whether buyers would remain bullish enough to hold the low above that and so far, that’s been the case. There were multiple support tests and holds of the 103.98 Fibonacci level, which is the 50% mark of the pullback from Q4, and it held well, not even allowing for a pullback to test support at prior resistance swings, nor the 200-DMA.
Now that we have a new high in-place, the same scenario could be investigated, grading trend continuation potential on just how aggressive bulls remain to be. A hold of the prior high at 104.60 would be an aggressive show, with a push down to 104.43 a bit less so, and that logic can be extended down for a test of 104.21.
But if 103.98 comes back into the picture quickly this will look like a false breakout and then bearish motive may come back into the picture. For a move of that nature, one would probably think that some aggressive dovish commentary would be required, or perhaps even a bit of negative U.S. economic data.
On that front – we do get a release of retail sales data on Thursday and given this report’s early-nature, it can certainly drive expectations of recently-completed consumer behavior. And then on Friday we get both PPI and Michigan Consumer Sentiment data, so motive certainly exists around the USD into the end of this week.
U.S. Dollar Four-Hour Price Chart
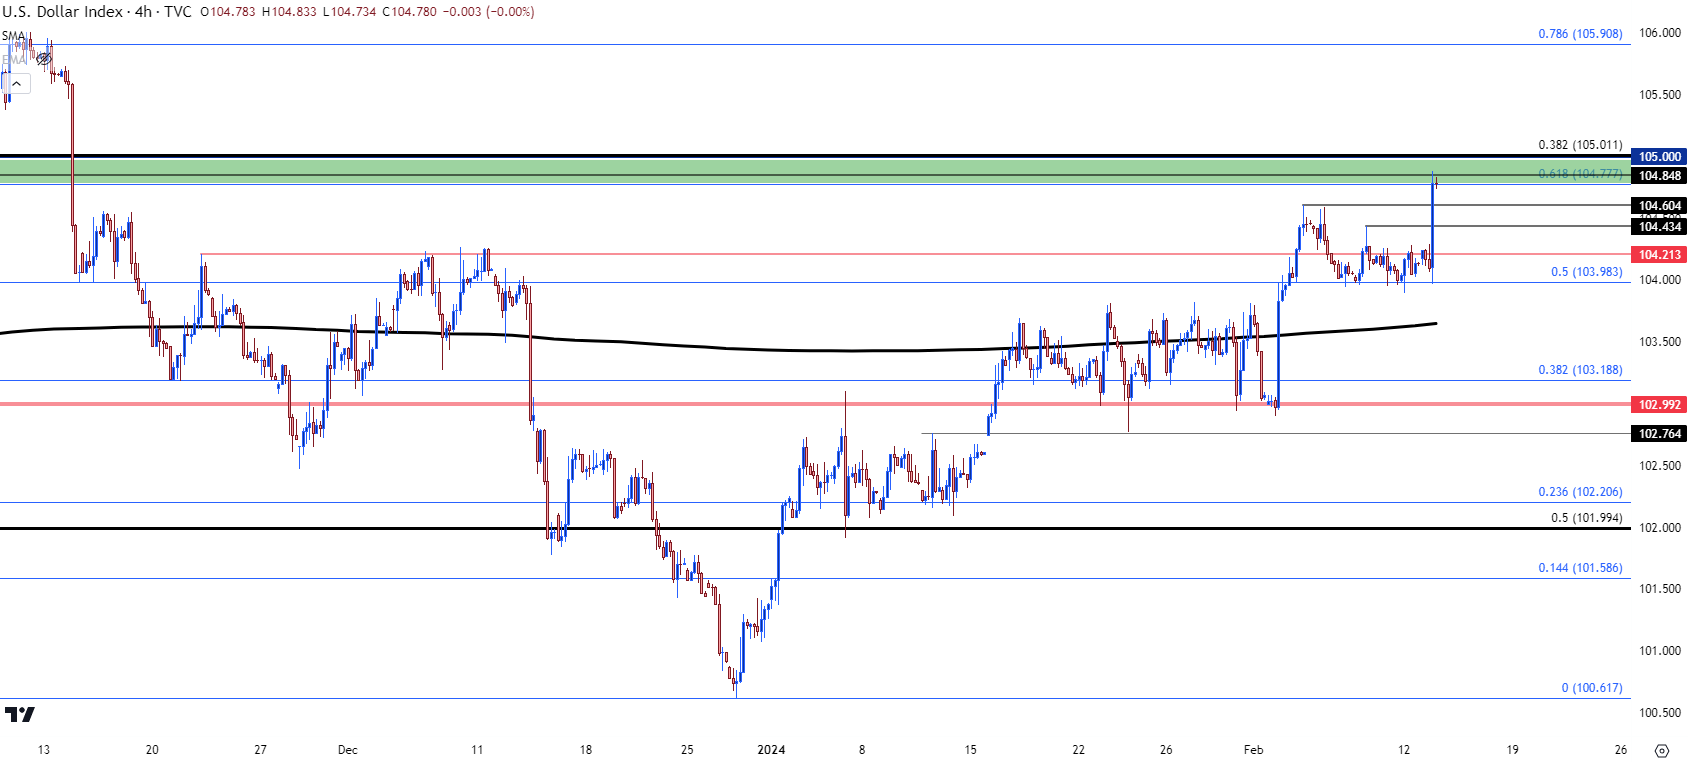 Chart prepared by James Stanley; data derived from Tradingview

EUR/USD
One of my personal aims of writing that U.S. Dollar background piece was to highlight one of the more unique aspects of FX. Because currencies are the base of the financial system, the only way to value a currency – is with another currency. Or, a basket of them, in the case of the U.S. Dollar. This means that good news may not price in for strength in that market, particularly if the ‘good news’ in the U.S. isn’t as good as that from Europe or Japan.
The Euro is especially important to the USD as the Euro is 57.6% of the DXY quote; so in many cases, if the European economy is outpacing that of the U.S., even good news in the United States may not amount to USD gains.
This was a major push point last year and the year before. The 2022 episode was perhaps more of an outlier as the Fed had started to ramp up rate hikes in 75 bp increments while the European Central Bank sat on their hand. This allowed for a strong one-sided move to develop in EUR/USD.
And then the effects of that – a strong U.S. Dollar effectively helping to slow U.S. inflation while a plunging Euro prodded European inflation higher: Eventually the ECB had to act and that’s what helped to produce the reversal in Q4 of 2022, as that change in posture between the central banks started to get priced-in.
That wasn’t the last of that scenario, however, as another similar theme started last summer, with the U.S. Dollar gaining for 11 consecutive weeks as EUR/USD continued to fall. A major push point to that was the delta in U.S. and European economic data, and Fed Chair Powell’s pivot in early-November helped the matter immensely as EUR/USD was holding at key support of 1.0500 as that meeting began.
The net of all this has been continued range in EUR/USD. It looked as though the range was going to breakdown as we walked into last November, which is what makes the timing of that dovish flip at the Fed all the more important as it helped to hold the lows and prod price back up to the topside of that range within a couple of months.
EUR/USD Daily Chart
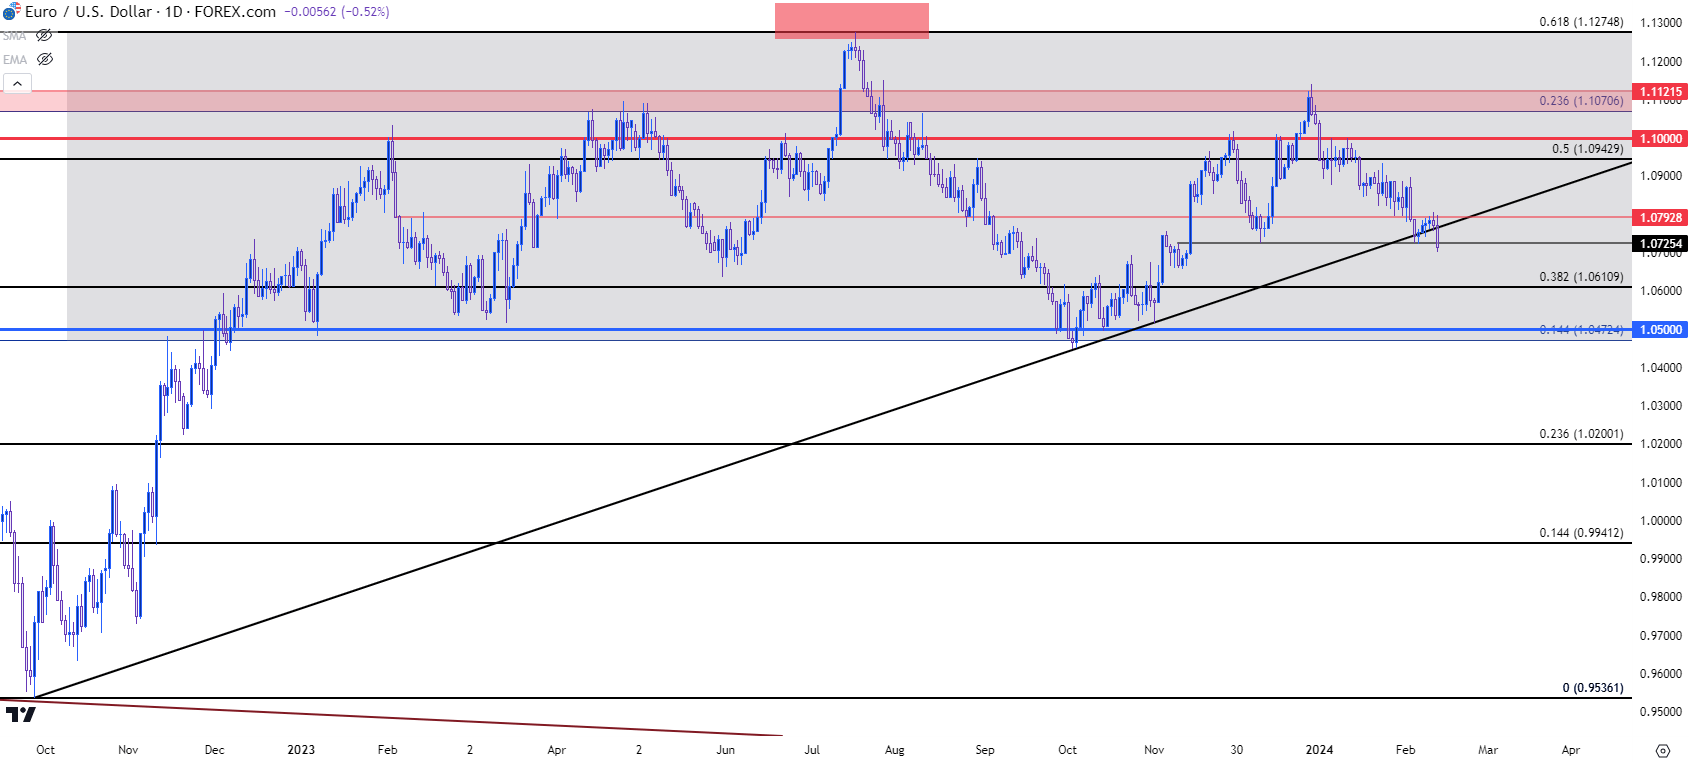 Chart prepared by James Stanley, EUR/USD on Tradingview
EUR/USD Shorter-Term
The 1.0725 level held the lows last week and bears took another push this morning after CPI data. The next area of support in the range runs from a Fibonacci level at 1.0610 up to the 2020 swing low at 1.0638; and, after that, there’s longer-term range support around the 1.0500 psychological level.
EUR/USD Daily Chart
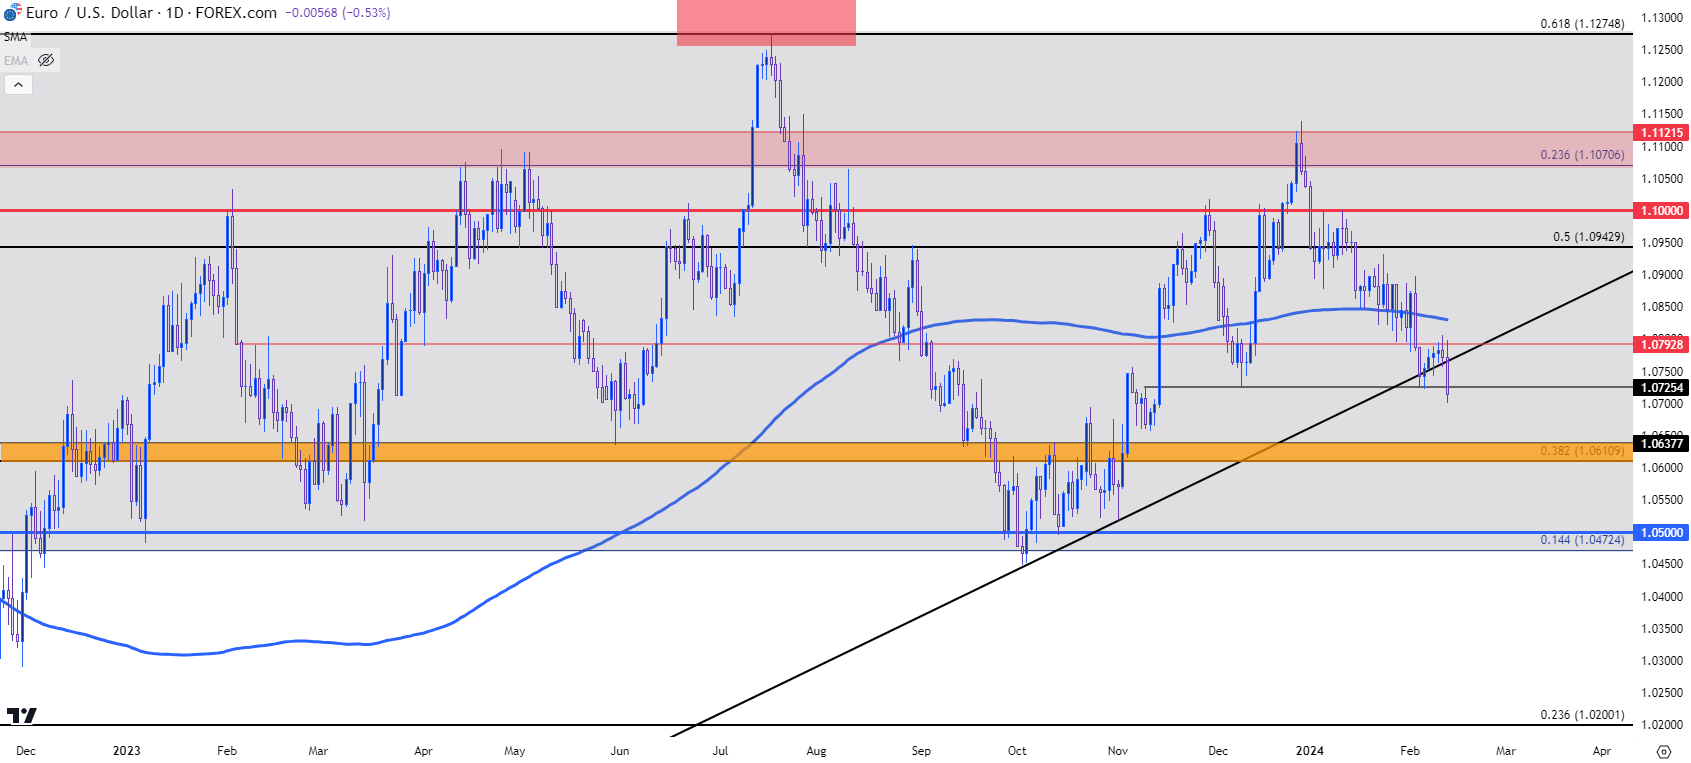 Chart prepared by James Stanley, EUR/USD on Tradingview
GBP/USD
We get CPI out of the U.K. tomorrow and GBP/USD retains an interesting backdrop. Core inflation is expected at 5.2% tomorrow and this raises questions around the recent dovish push at the Bank of England, which had served to unsettle the prior theme.
Ahead of that, GBP/USD held well even as U.S. Dollar strength was showing up to start the year. GBP/USD was one of the few pairs that did not re-test the 200-day moving average in January and a fairly consistent range had developed which illustrates how GBP was holding its own against U.S. Dollar strength.
The BoE meeting earlier this month was just after the Fed and it led to an initial pullback which was quickly met with buying pressure. But the NFP report was released a day later and that’s what finally drove a deeper pullback in the pair, allowing for a re-test of the 200DMA. At this point, bulls have tried to run a bounce from that and appear to be trying to hold higher-low support above the 200-day moving average. While this isn’t bullish on its own, from a relative basis, this could remain as one of the more attractive ways to fade the recent run of U.S. Dollar strength.
For resistance, the 1.2720-1.2758 area has remained strong through more than two months of tests and if buyers can get back in the driver’s seat, that remains a hindrance.
GBP/USD Daily Price Chart
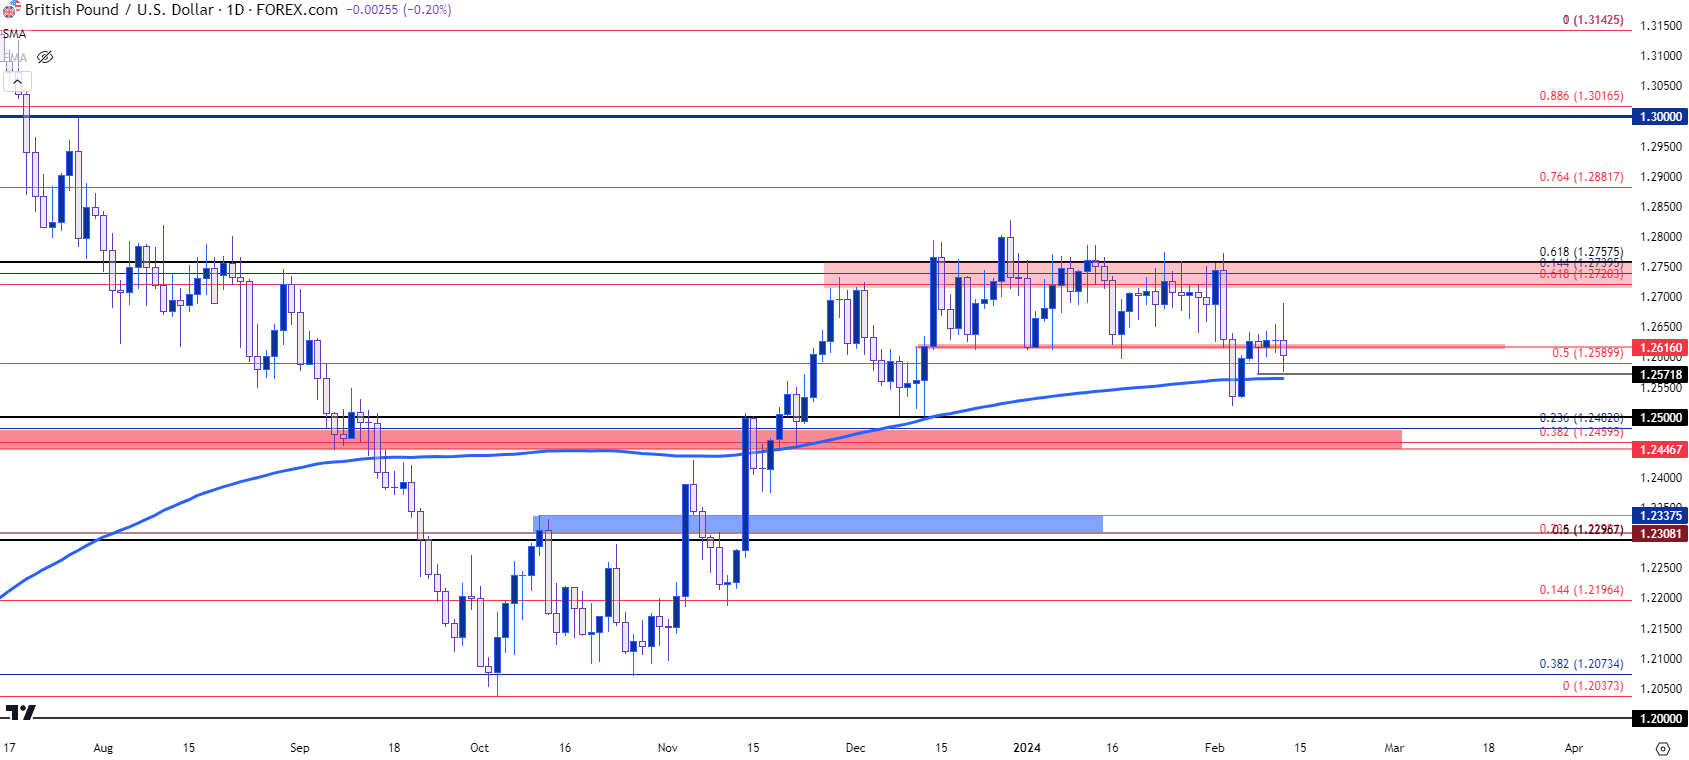 Chart prepared by James Stanley, GBP/USD on Tradingview
USD/JPY
Going along with that 2024 recovery in the U.S. Dollar we have a bullish trend in USD/JPY that’s now eclipsed 1,000 pips from the late-December swing-low. The challenge now is the same resistance that’s held the highs over the past two years, running from the psychological level of 150 up to the 152-handle.

USD/JPY Weekly Price Chart
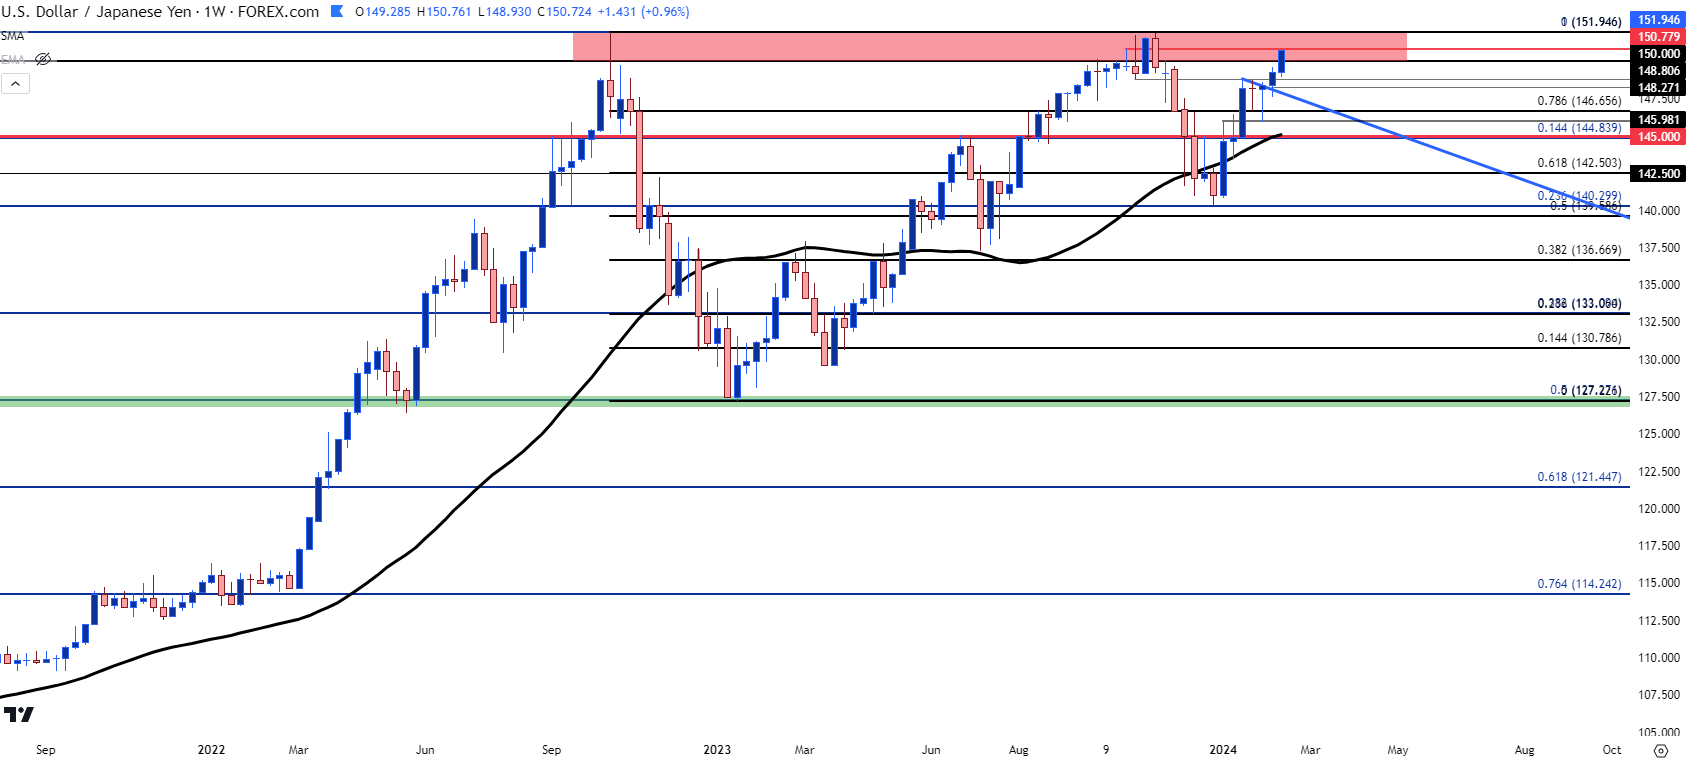 Chart prepared by James Stanley, USD/JPY on Tradingview
With some rate cuts getting priced-out of the U.S. and Japan showing no apparent interest in touching policy, the one major push point here would be warnings from the Japanese Finance Ministry regarding currency movements.
That’s what helped to set the top in 2022, although it wasn’t immediate. The Finance Ministry ordered an intervention in October, which helped to hold bulls at bay for a few weeks. But it was the CPI report released on November 10th of that year that finally drove the carry unwind theme.
A similar scenario showed around CPI a year later, also after a test in the 150-152 area. But what differed here from the prior year were rate expectations in Europe. In 2022, as markets started to price in more rate hikes from the ECB there was even more motive for bullish bets to leave the USD, which helped to sink many USD-pairs, USD/JPY included.
But when a similar theme showed a year later, that run of USD-weakness couldn’t hold through the end of the year, and as we’ve seen this morning, there’s been an extension of both bullish USD and higher U.S. rate themes which has helped USD/JPY to drive right back into that key resistance zone.
The big question now is whether the Finance Ministry gets more vociferous on the matter: They’ve already issued the common initial warnings, that they’re ‘watching FX moves.’ But, so far, FX traders seem undeterred as that carry has continued to price-in to USD/JPY strength.
USD/JPY Daily Price Chart
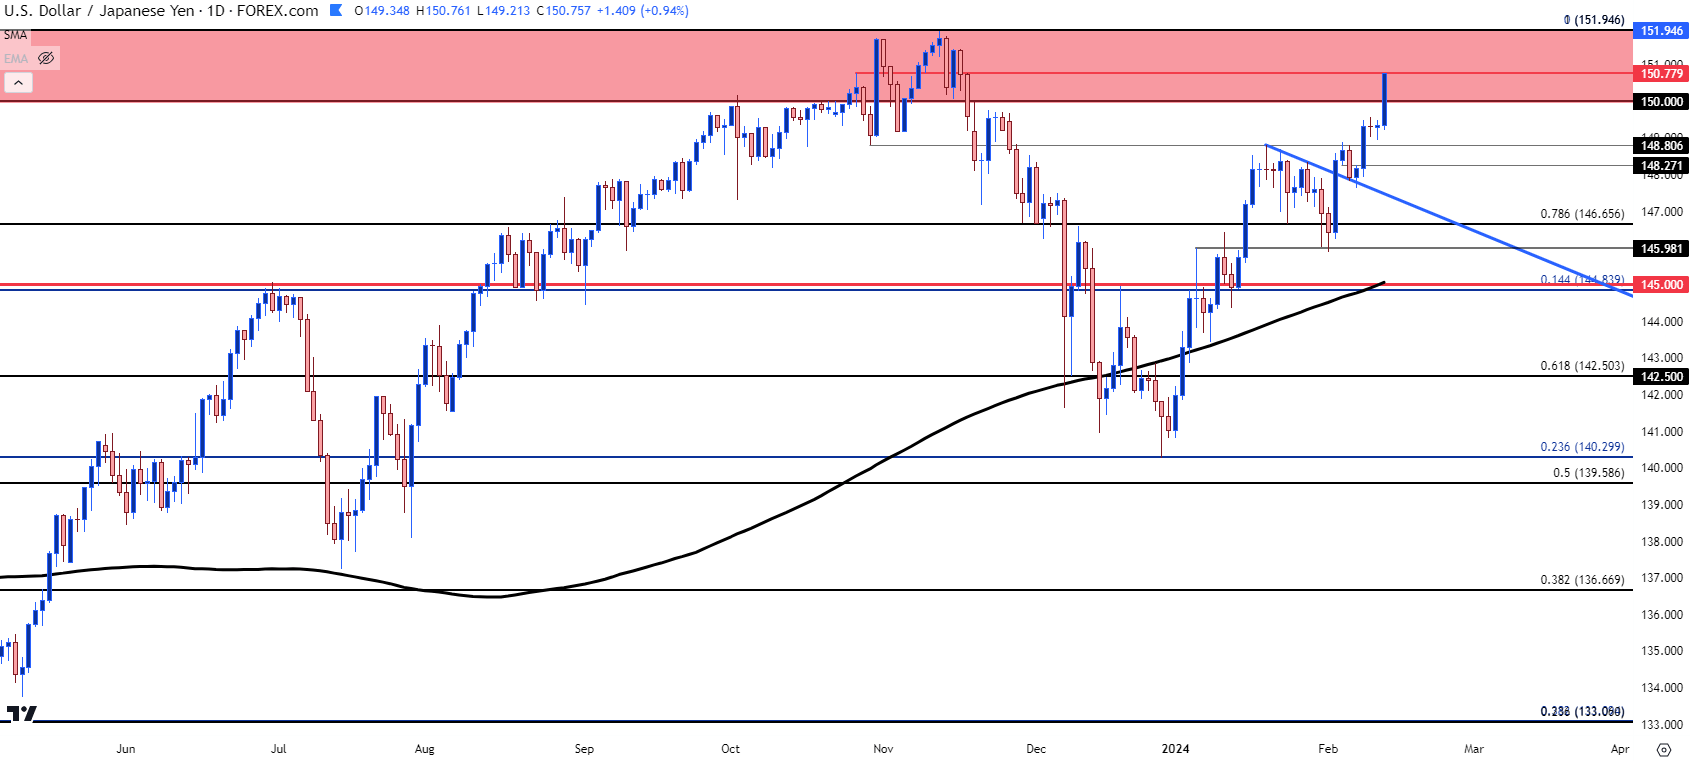 Chart prepared by James Stanley, USD/JPY on Tradingview
XAU/USD (Gold)
Well, it finally happened, spot gold pushed back below the $2k psychological level. I remain of the mind that gold does have the ability to push a bullish trend above the big figure; but I don’t think that happens substantively until after the Fed has pushed a pivot and given continued strength in U.S. economic data that pivot remains a giant question mark as far as timing is concerned.
Spot gold broke-out above the $2k level after the December FOMC rate decision and it hasn’t traded below it ever since. Bulls even retained potential into last week, with price holding on to a bullish trendline marking higher-lows; but that trendline has been broken this week and it was even a quick shot of resistance this morning, just before the $2k break.
XAU/USD (Gold) Four-Hour Chart
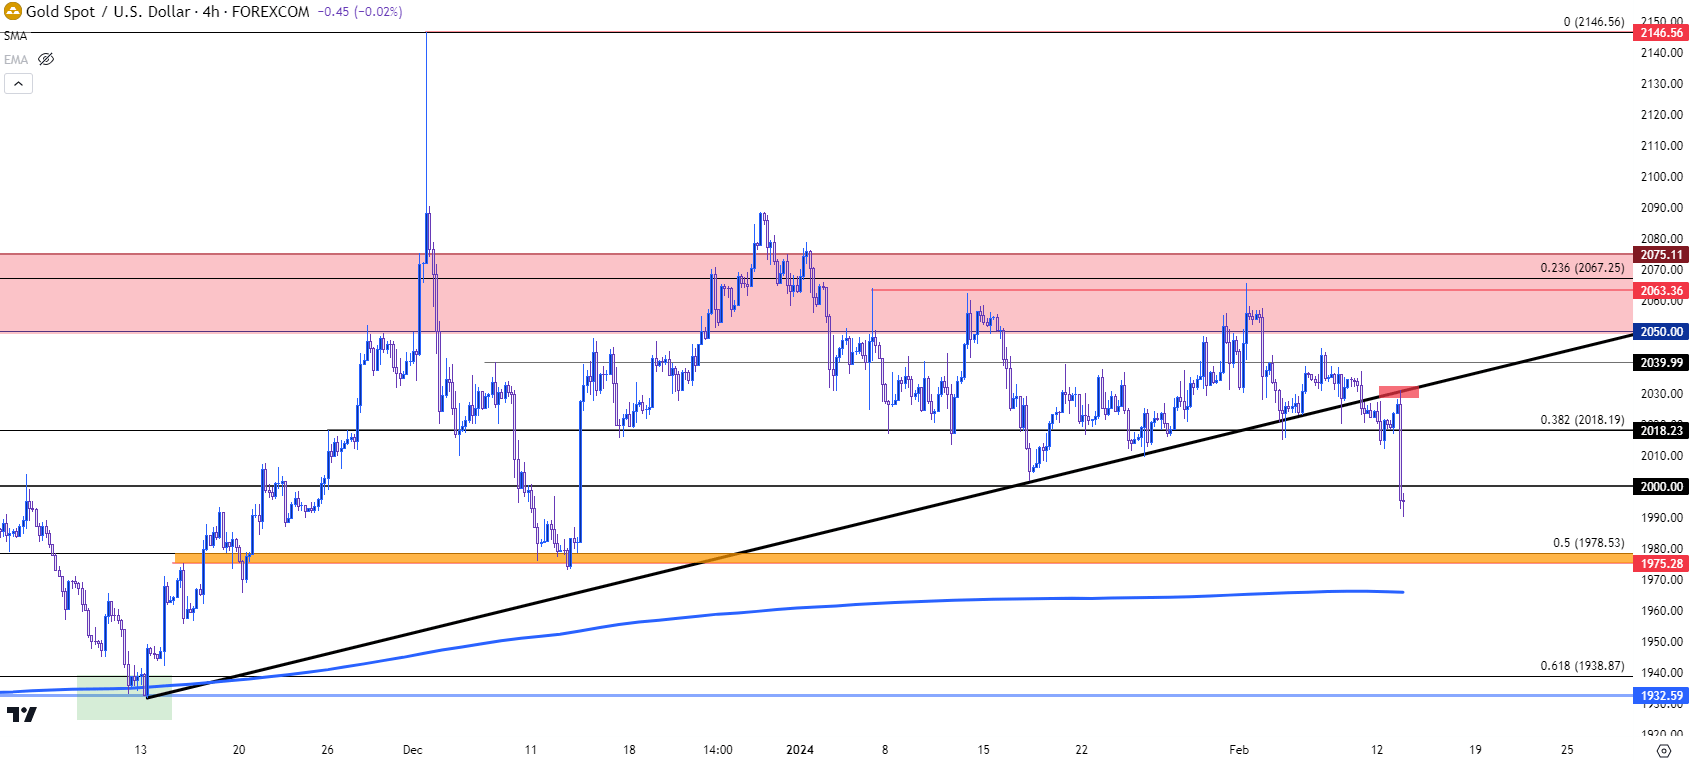 Chart prepared by James Stanley, Gold on Tradingview
Gold bears now have an open door, but the question remains how aggressively they’ll push. Because while we are seeing rate cuts get priced-out of the U.S., the general posture is still that the Fed will pivot at some point later this year and that can give bulls reason to hold on through a deeper drawdown.
For support, there’s a key spot nearby and it’s the same area where gold had pivoted in December, around the 50% mark of the recent bullish move. That plots at 1978 and there’s a prior swing at 1975. Just below that is the 200-day moving average which hasn’t been tested since just before the CPI report released in November. And if bears do make a run for it, there’s a deeper spot of support around the 1932 level, confluent between a prior price swing and the 61.8% Fibonacci retracement of that recent major move.
XAU/USD (Gold) Daily Chart
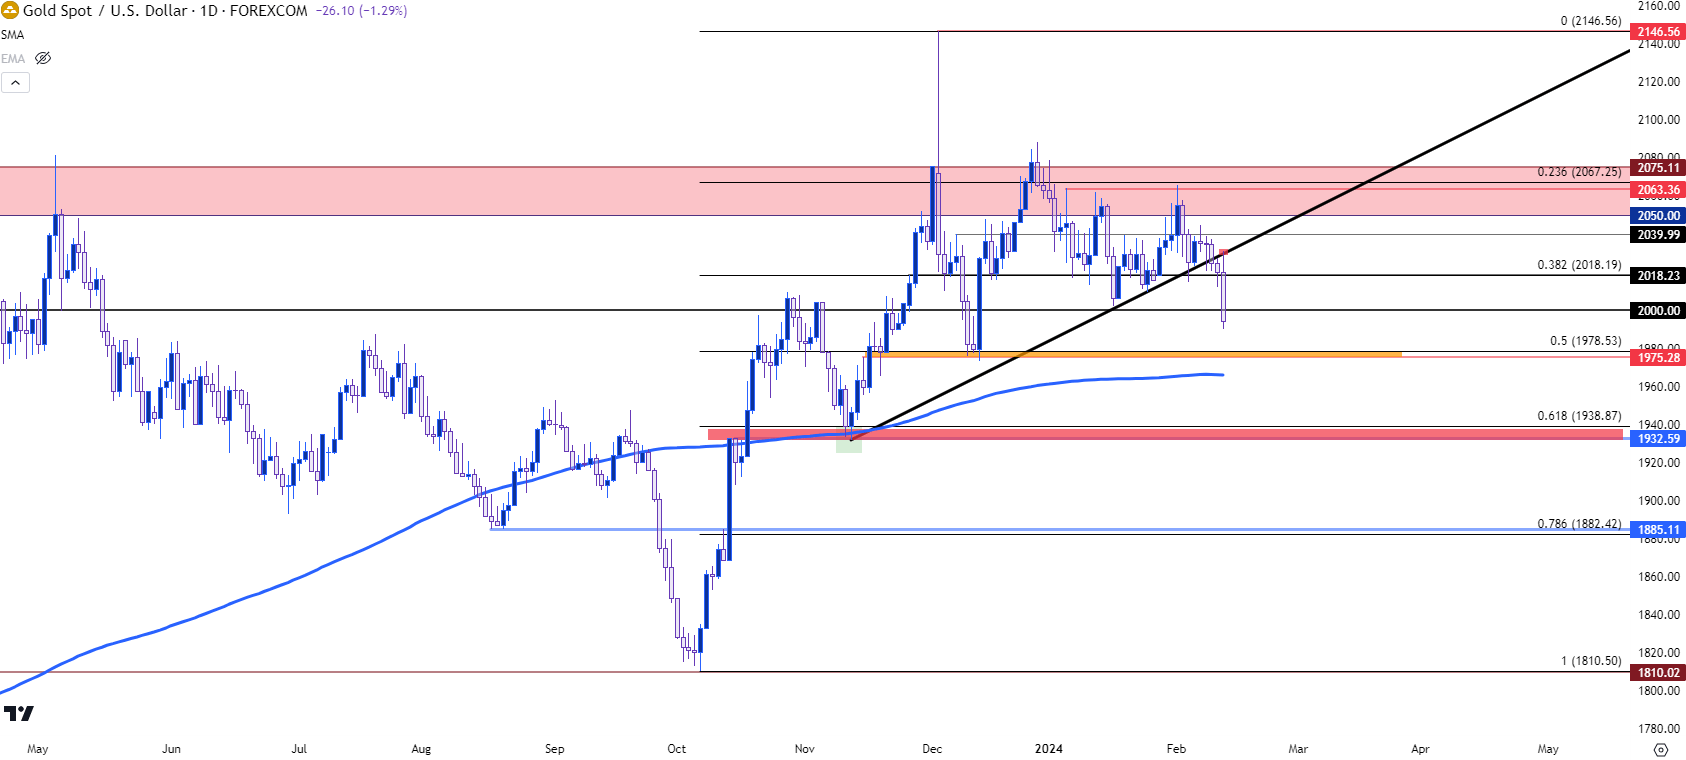 Chart prepared by James Stanley, Gold on Tradingview
--- written by James Stanley, Senior Strategist
Latest market news
Yesterday 01:32 PM
Yesterday 09:35 AM
Yesterday 07:23 AM
Yesterday 04:48 AM
Yesterday 12:17 AM
July 25, 2024 10:39 PM
Latest Trade Ideas articles

Yesterday 09:35 AM

Yesterday 12:17 AM

July 25, 2024 10:39 PM

July 25, 2024 05:30 PM