


US Dollar Talking Points:
- The US Dollar is nearing a fresh 2023 high as the rally in DXY has now hit 10 consecutive weeks, the first time that’s happened since 2014.
- While there remain expectations for rate cuts from the Fed in 2024, that theme took a step back last week during the FOMC rate decision when the bank cut their expectation down to two from a prior read of four rate cuts expected for next year.This ‘less dovish’ forecast has helped to prod Treasury yields higher, which is driving the US Dollar along with it.
- I’ll be discussing these themes in-depth in the weekly webinar on Tuesday at 1PM ET. It’s free for all to register: Click here to register.
If the first two quarters of 2023 were consolidative in the US Dollar, the third quarter was anything but that. July trade started with favor for DXY bears as the currency broke down shortly after the monthly open on the back of a dismal inflation print. DXY traded below 100 for the first time in more than a year and with EUR/USD bucking up to 1.1275, there was an open door for DXY bears and EUR/USD bulls to continue driving trends.
But that didn’t happen. The breakdown in DXY failed as prices quickly snapped back, and for the past 10 weeks USD bulls have controlled the matter by driving the trend in the US Dollar. At this point the currency has gained for ten consecutive weeks and that’s the first time that’s happened for the USD since 2014 trade. It’s currently staring down its 2023 high that was previously set in March, just before the banking crisis showed up on US shores.
This theme shows cleanly from the monthly chart, with highlight around the 102 level in DXY which has served as a pivot, of sorts. There was a collection point of support as shown by wicks on monthly candles around that level, but you can also clearly see the failed breakdown attempt from bears in July, leading into a strong snapback move that’s so far run through August and September.
US Dollar - DXY Monthly Price Chart (indicative only, not available on Forex.com platforms)
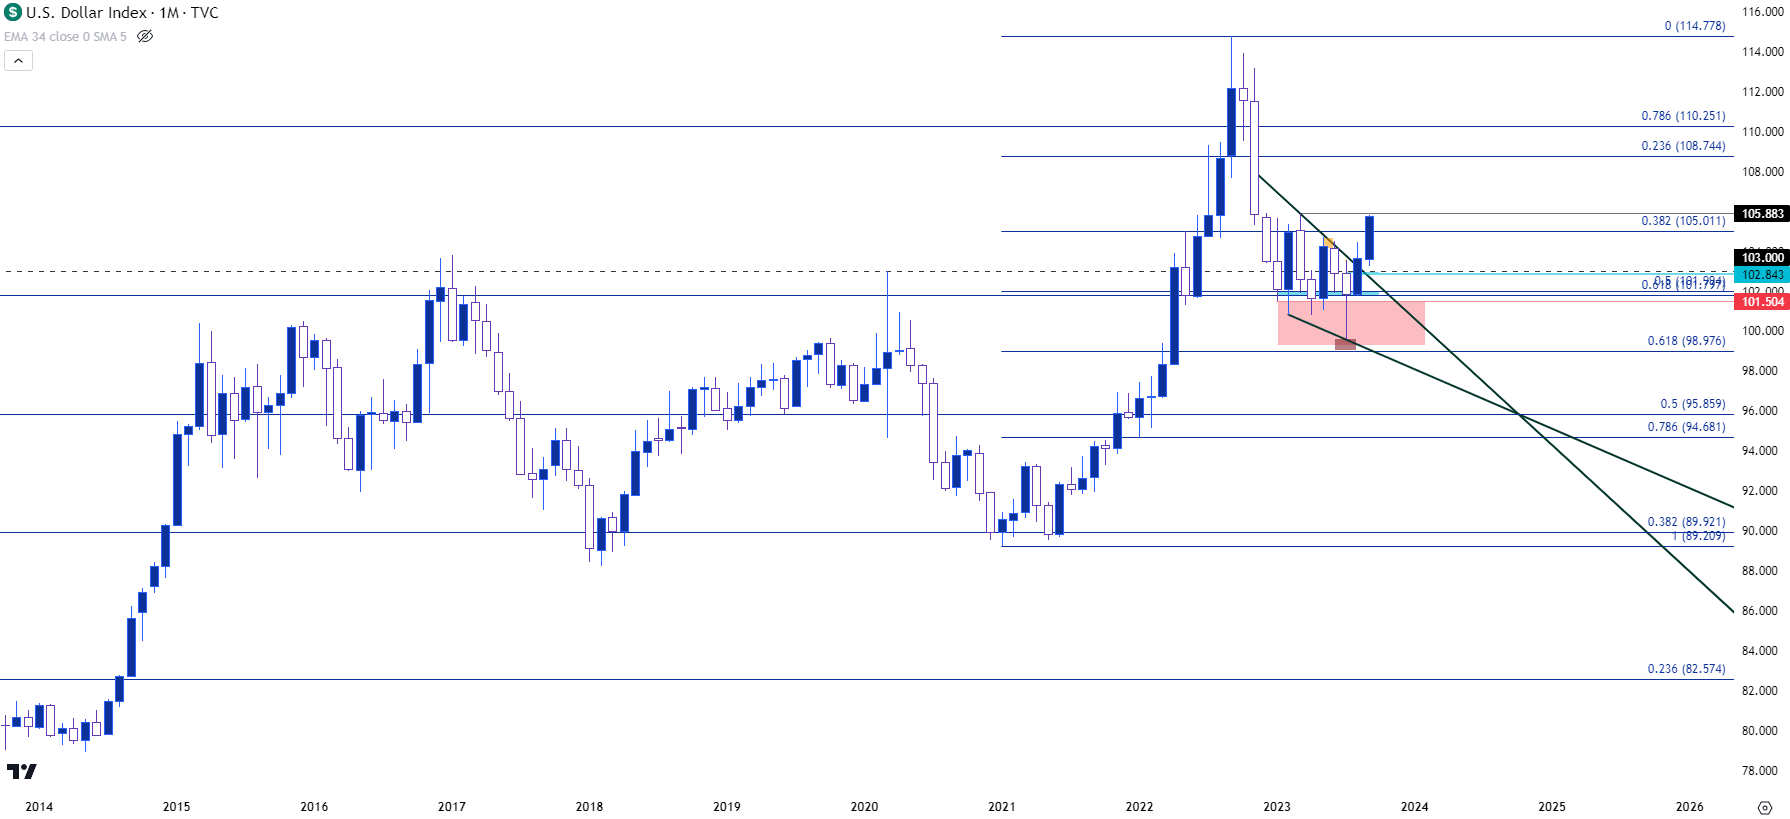
Chart prepared by James Stanley; data derived from Tradingview
A look at 10-year Treasury yields helps to put some narrative behind this theme, as there’s been a similar, albeit less clean theme running there.
Notably the 10-year pushed above 4.5% last week for the first time since 2007, or before the financial collapse. This also shows how we may not be at the end of this theme yet, and this suggests that US data will be closely tracked for continued signs of strength in effort of metering just how hawkish the Fed may need to be as we move into 2024 trade.
The takeaway from this chart is how the bullish trend in yields has recently awoken. You can see where yields were consolidating for much of the first half of the year, similar to what we just looked at above in DXY. But, in the 10 year support held around 3.25% and we’ve seen a strong streak develop, with five consecutive months of gains as yields have broken out of a falling wedge pattern.
This adds questions to how long this trend might run and given the dearth of recent historical context there’s only levels from 15+ years to operate with.
US Treasury Yields – 10 Year – Monthly Chart (indicative only, not available on Forex.com platforms)
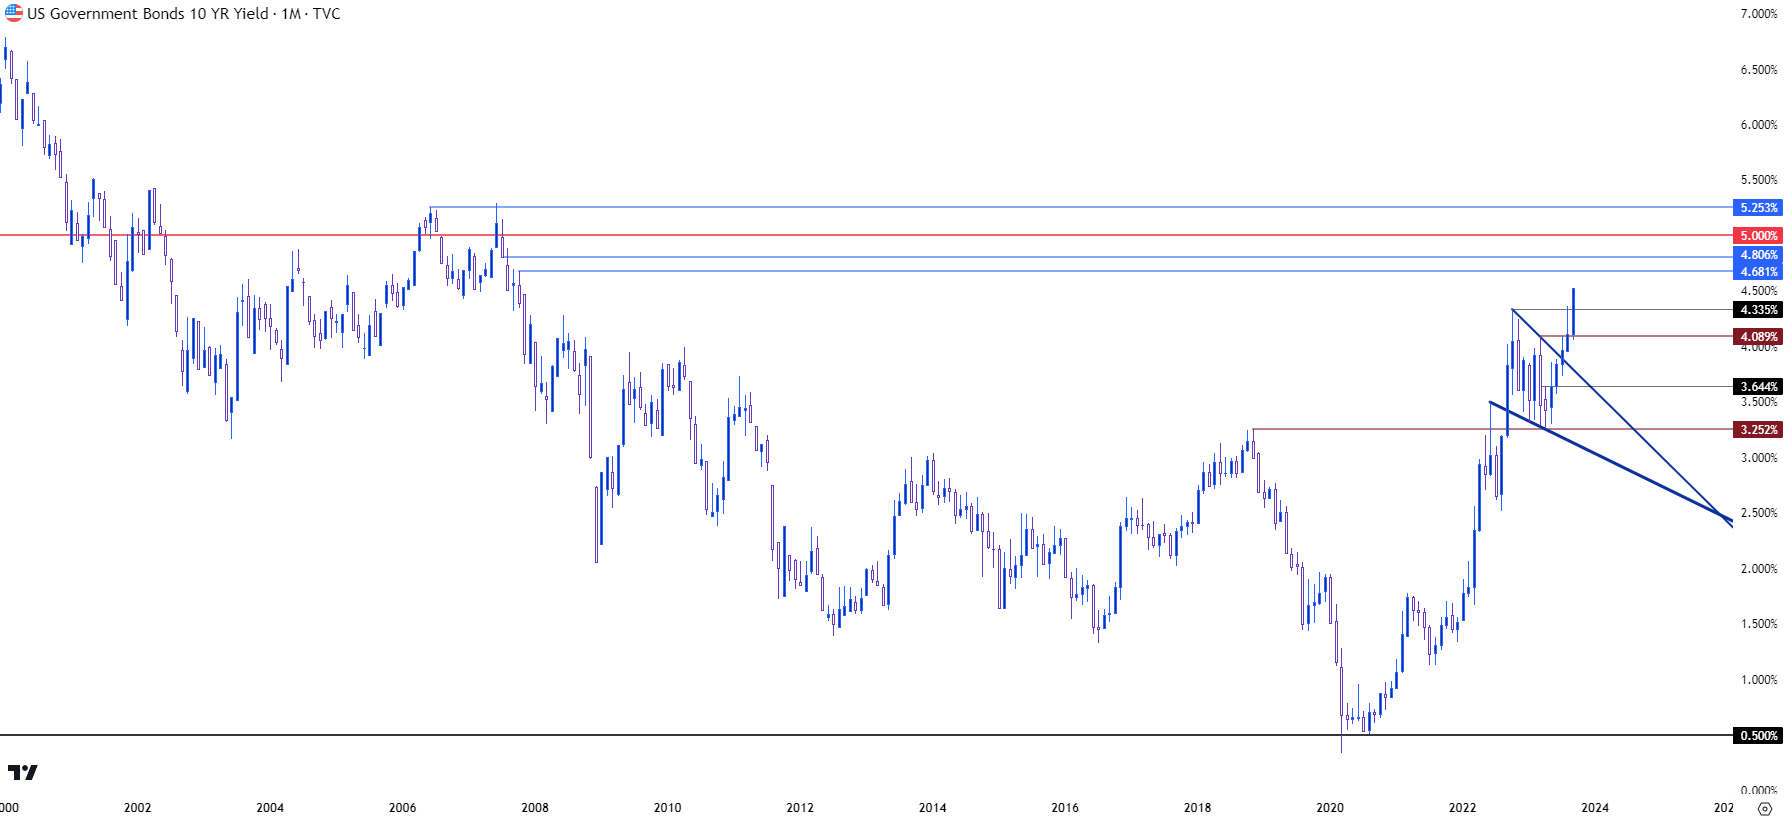
Chart prepared by James Stanley; data derived from Tradingview
US Dollar Intermediate Term
From the weekly chart below we can see the same falling wedge but this time in the US Dollar as opposed to Treasury Yields.
Ever since the failed breakdown in July bulls have been in-control, and that’s led to a fast push back up to 105.88, and at this point, the Greenback is working on its 11th consecutive weekly gain, which brings up another item of interest: Is the US Dollar overbought?
We can probably say that from some perspectives that’s the case, and the prior instance of 10 or more weekly gains is notable as that episode showed a 12-week streak back in 2014, which led to a pullback. But then bulls re-charged during that pullback and continued driving the trend well into 2015 trade. The move amounted to more than 25% in the US Dollar and only a portion of that priced-in during the early stage, when the streak was building.
The fact that we’ve seen such a clean run of gains in such an important market of the world’s reserve currency may just be sending a message…
But, from a tradable perspective, the big question is whether we get a pullback now that this bullish trend has been well-priced, and price has put on a challenge of the 2023 high. At this point we’ve seen vigorous defense of higher lows during this trend, but there remains potential for the same. The 105 level is notable as this is a longer-term Fibonacci level that’s also a psychological level. This price helped to hold resistance and at this point, its confluent with the 14.4% retracement of the bullish move.
But to put the recent rally into perspective the DXY could drop down to 102.73, which is the 50% mark of that recent bullish move, and still retain a topside trend bias. In between those levels, the 103.50 area also seems key as there’s a 38.2% Fibonacci retracement there along with a few prior price swings.
US Dollar - DXY Weekly Price Chart (indicative only, not available on Forex.com platforms)
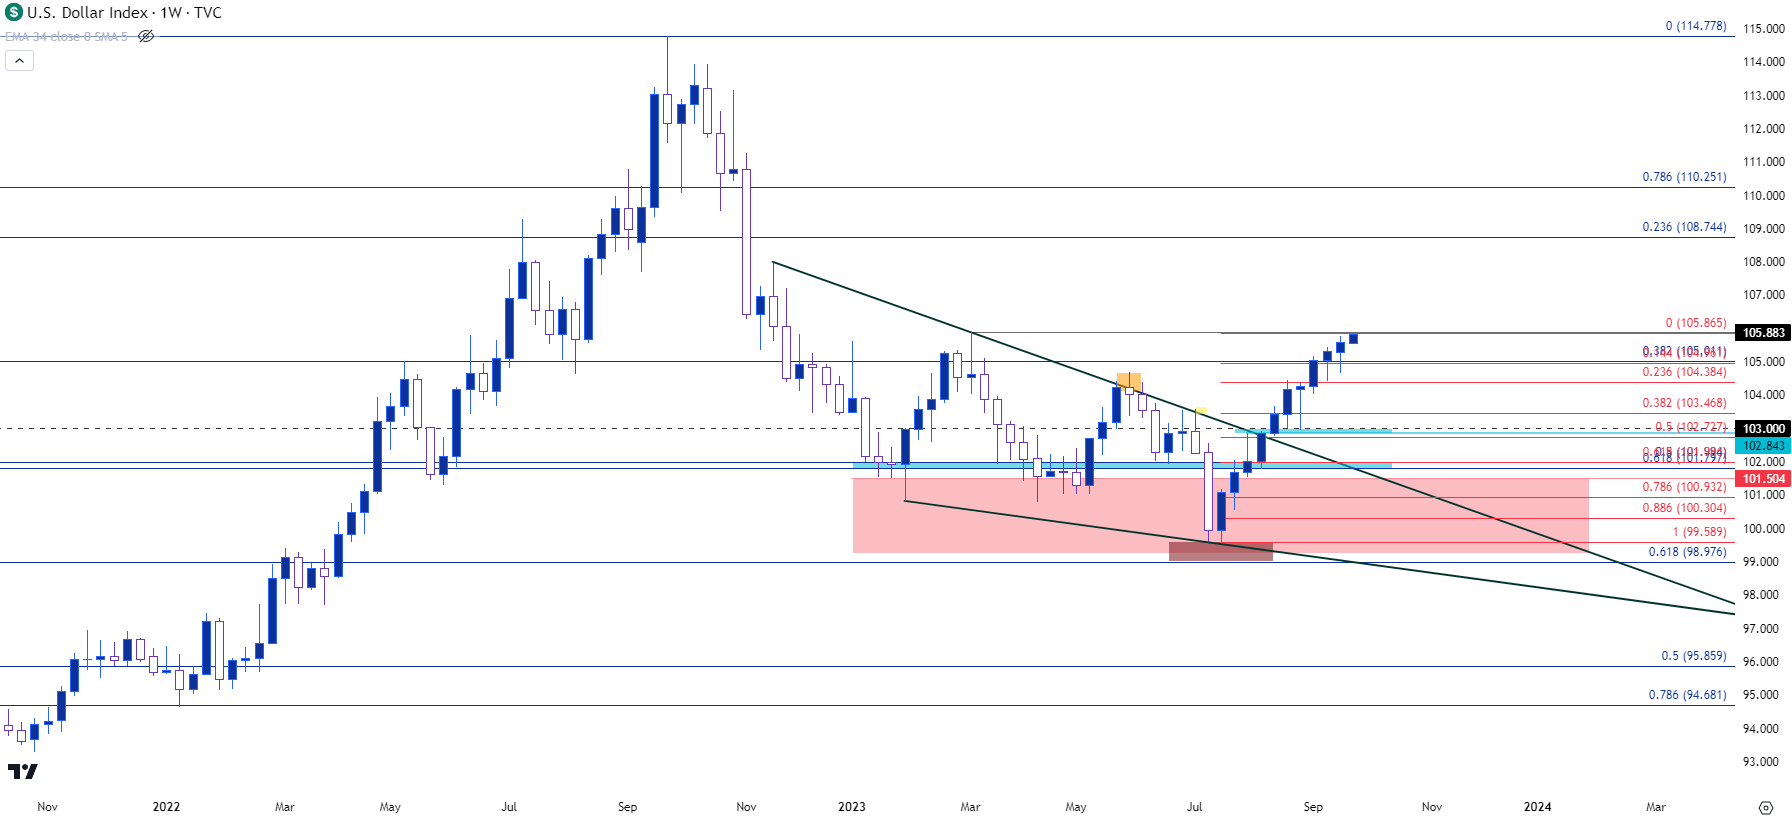
Chart prepared by James Stanley; data derived from Tradingview
US Dollar Shorter-Term
At this point the concern would be chasing an overbought trend that’s just started to tangle with resistance at the prior 2023 high. But, this bullish move happened during a crucial couple of weeks on the economic calendar when we heard from the ECB, the BoJ, the BoE and the Federal Reserve. So this may have been a result of markets re-pricing rate expectations around a slew of central banks.
From the daily chart below we can get more detail on this recent trend. RSI on the daily has been overbought/diverging for a month now but that’s not necessarily a great timing indicator, although it does suggest that bulls should exercise caution as an overcrowded trade could lead to a sizable pullback, while still retaining bullish trend qualities.
Last week’s higher low which was produced on the same day as FOMC was at 104.70, so if bulls hold support for this week above that spot, the door for continued breakout and topside trend continuation remains open.
For higher-low potential, the 105.00 level is of note, but there’s also another spot of interest at 105.39, which is the 38.2% Fibonacci retracement of the pullback move in DXY that began last September.
Below 104.70, the next item of support is at 104.45 and if bears can evoke a push through that, we may be looking at the deeper pullback scenario.
On the resistance side of the USD, there’s a prior swing around 106.32 which remains of note, and then there are possible points of interest at 107.18 and 107.59, the former of which is the 50% mark of the pullback move while the latter is a prior price swing of support-turned-resistance.
US Dollar - DXY Daily Price Chart (indicative only, not available on Forex.com platforms)
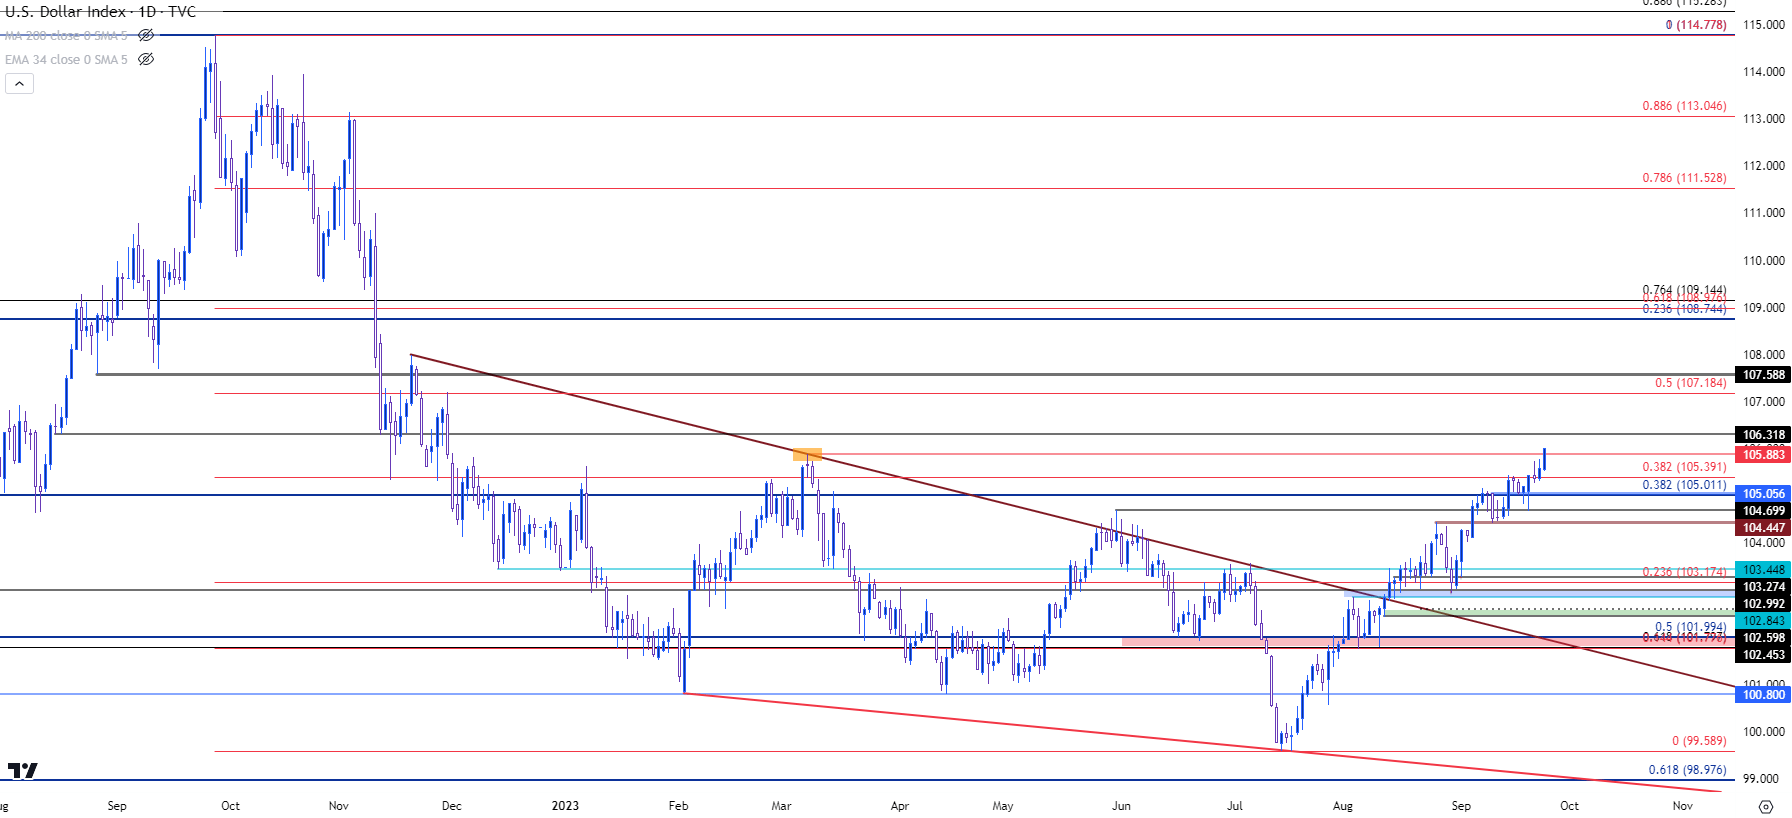
Chart prepared by James Stanley; data derived from Tradingview
--- written by James Stanley, Senior Strategist
Latest market news
Today 01:35 AM
Yesterday 10:28 PM
Yesterday 04:00 PM
Latest Trade Ideas articles


Today 01:35 AM

Yesterday 04:00 PM