


Market positioning for crude oil is not too hot, nor too cold
Short exposure to crude oil has been trending higher among large speculators and managed funds since late March, although clearly they remain net-long overall. And whilst long exposure dipped a couple of weeks ago, both sets of traders increased long exposure last week and net-long exposure remains at a healthy level overall. And neither is it at a sentiment extreme, to warn of a major trend change.

My take on this is that both the downside and upside potential for oil may be capped over the near-term. As underwhelming as this may be from a speculative perspective, it is still useful information to have, as it can manage our expectations accordingly; perhaps we’re not looking for an imminent move to $100 in the same way that a plunge to $60 seems far fetched. And as oil prices have fallen over 12% since the April high, perhaps shorting crude oil is becoming ‘long’ in the tooth.

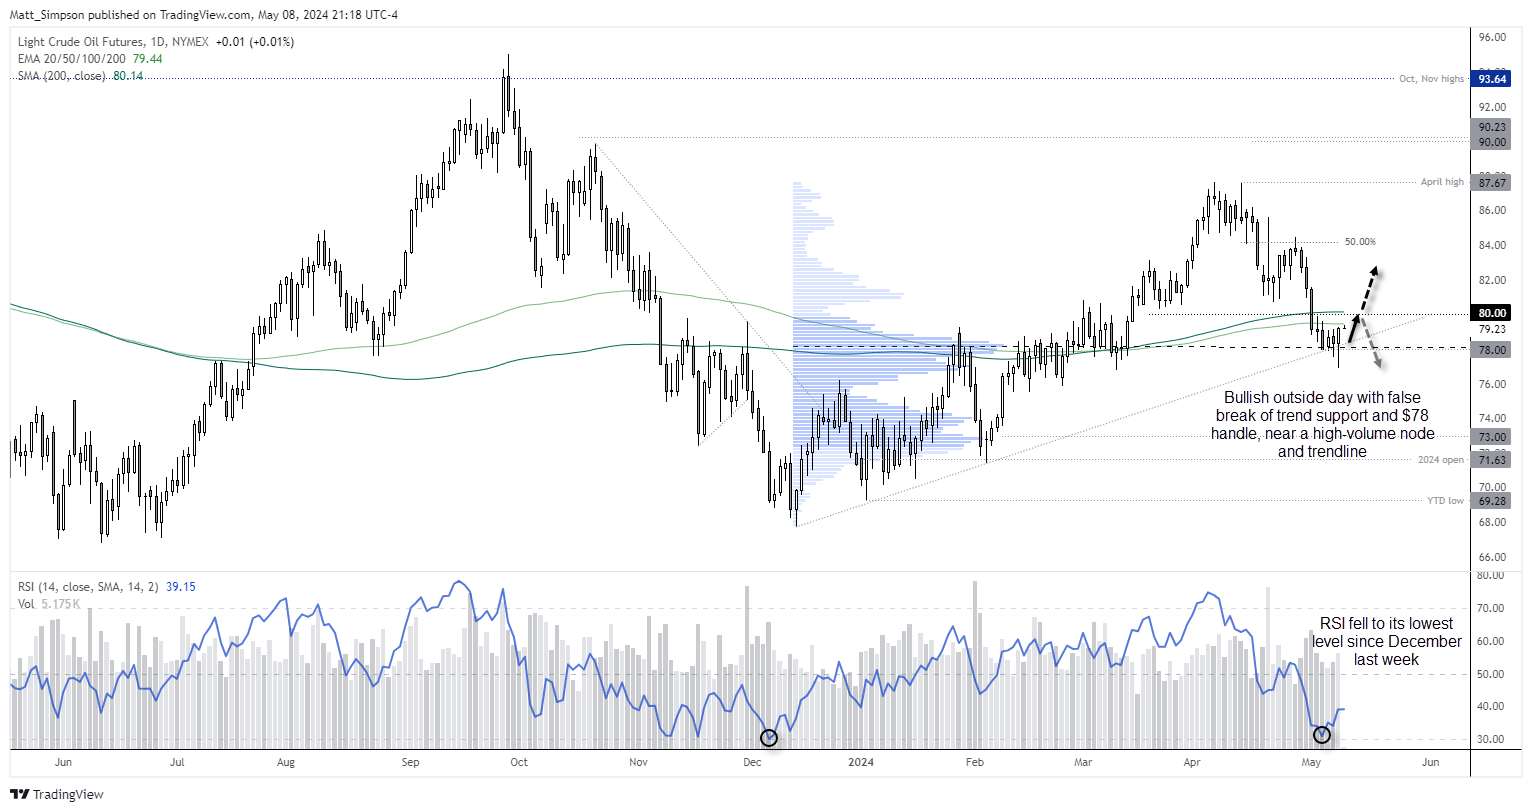
WTI crude oil technical analysis (daily chart):
The daily chart shows a clear 3-wave retracement from the April high. And what makes me suspect it might mark the end of a correction is Wednesday’s bullish outside day, with a false break of $78 leaving a lower tail and recovery back above trend support. Given RSI (14) came very close to oversold last week and fell to its lowest level since December, a case for a bounce seems apparent.
That is not to say any such bounce will be a walk in the park, but I would err on the side of caution with being short around these lows.
What might make any rebound scrappy is that the 200-day average and EMA are near the $80. Already that seems to be having a dampening effect on prices rising for a second day, so bulls may want to see dips on lower timeframes and seek to exit around the averages or the $80 handle.
We’d likely need to see a break or daily close above the $80 handle or 200-day MA at $80.20 before being too confident that a decent bounce is underway. But with oil having fallen 12% in a few weeks, traders remaining net short and the potential for the US dollar to extend losses, my bet is that it will manage to break above $80.20 in due course.
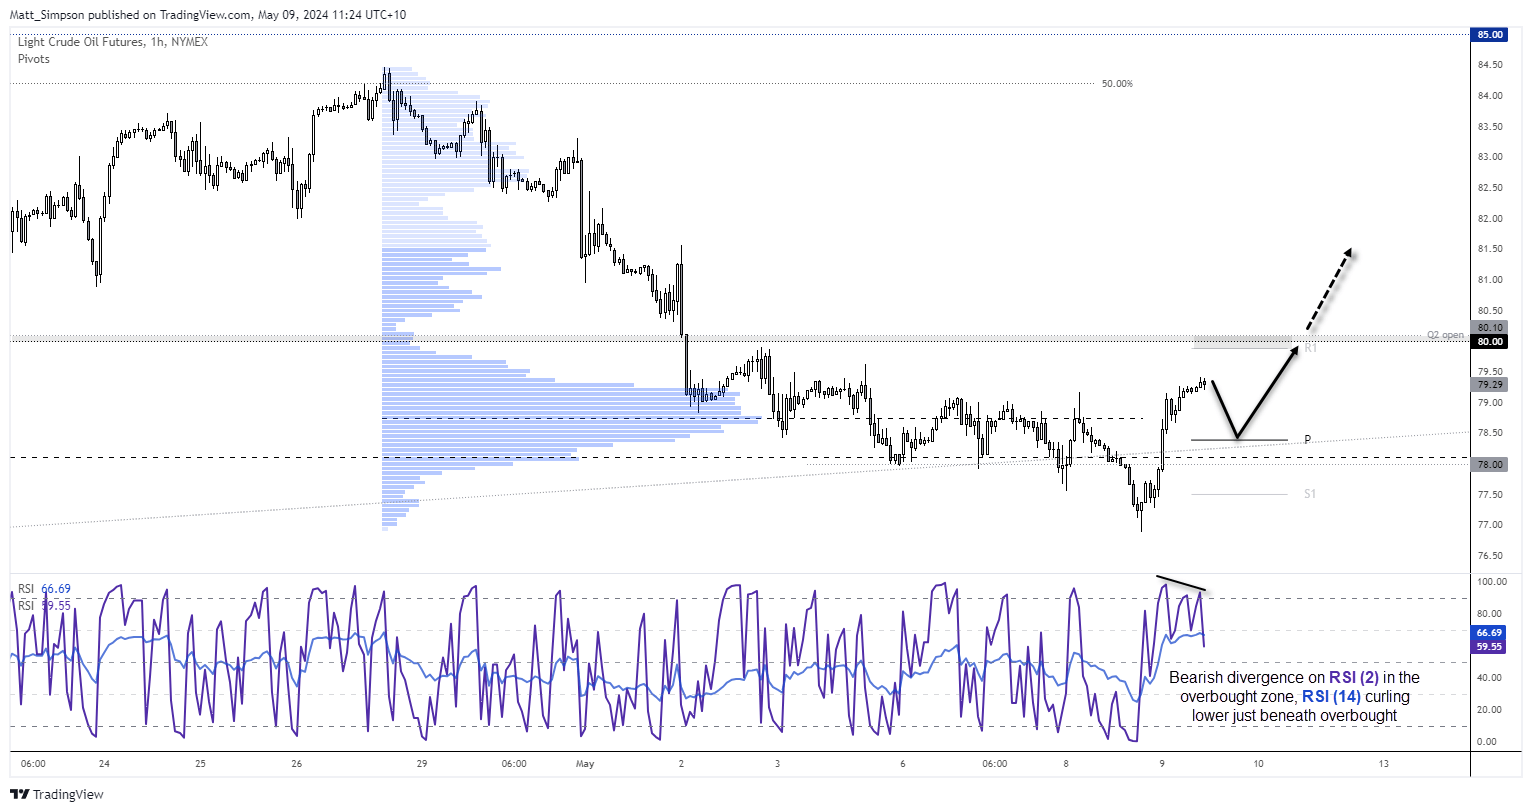
WTI crude oil technical analysis (1-hour chart):
A mini v-bottom formed on the 1-hour chart of crude oil to suggest the low could be of significance. Furthermore, the baulk of trading volumes from the previous decline has occurred at the lows, and with prices rebounding sharply higher it implies that some of these bears would have already been forced to cover.
Yet with the RSI (14) curling lower and a bearish divergence having formed on the RSI (2) within the overbought zone, I am now seeking a retracement lower before a higher low forms. The broken bullish trendline or daily pivot point around 78.50 may offer some support, in which case bulls could then seek an entry at a lower price for an anticipated move towards the $80 handle. A decent break above which assumes bullish continuation in line with the bias outlined on the daily chart.
-- Written by Matt Simpson
Follow Matt on Twitter @cLeverEdge
How to trade with City Index
You can trade with City Index by following these four easy steps:
-
Open an account, or log in if you’re already a customer
• Open an account in the UK
• Open an account in Australia
• Open an account in Singapore
- Search for the market you want to trade in our award-winning platform
- Choose your position and size, and your stop and limit levels
- Place the trade
Latest market news
Yesterday 01:32 PM
Yesterday 09:35 AM
Yesterday 07:23 AM
Yesterday 04:48 AM
Yesterday 12:17 AM
July 25, 2024 10:39 PM
Latest Trade Ideas articles

Yesterday 09:35 AM

Yesterday 12:17 AM

July 25, 2024 10:39 PM

July 25, 2024 05:30 PM