


- AUD/USD outlook: Aussie struggles as momentum fades
- NZD/USD outlook: Bulls failing to show up after last week’s breakout
- WTI outlook: Crude oil outlook testing base of breakout
Dollar mixed in quiet trade ahead of retail sales
The start of this week has been very quiet after a more volatile-than-usual start to the summer months. The lack of top-tier news from the US and Europe means traders are largely sitting on their hands, especially with the also Fed entering a blackout period ahead of next week’s FOMC meeting. Still, we have a handful of potentially market-moving data to look forward to this week, including today’s release of US retail sales. We will also have CPI reports from Canada, New Zealand and the UK over the next 24 hours, while Australian jobs report will be monitored closely by those speculating on the AUD on Thursday. At the time of writing, the dollar was weaker against the pound, euro and yen, but higher against the antipodean dollars in a mild risk-off trade.
AUD/USD outlook: Aussie struggles as momentum fades
The AUD/USD has spent the past few sessions consolidating its recent gains, suggesting that it is gearing up for another breakout soon. However, in contrast to the likes of the EUR/USD, CHF/USD and GBP/USD, the Aussie has not been able to break out of its recent range high at 0.6900, hit in June, let alone a new 2023 high above the February high of 0.7158. This is clearly a sign of relative underperformance. But it also makes the Aussie a value trade on the long side, since it may have some catching up to do especially with risk appetite being positive across most major markets – most notably the US where the Nasdaq is now up some +40% on the year.
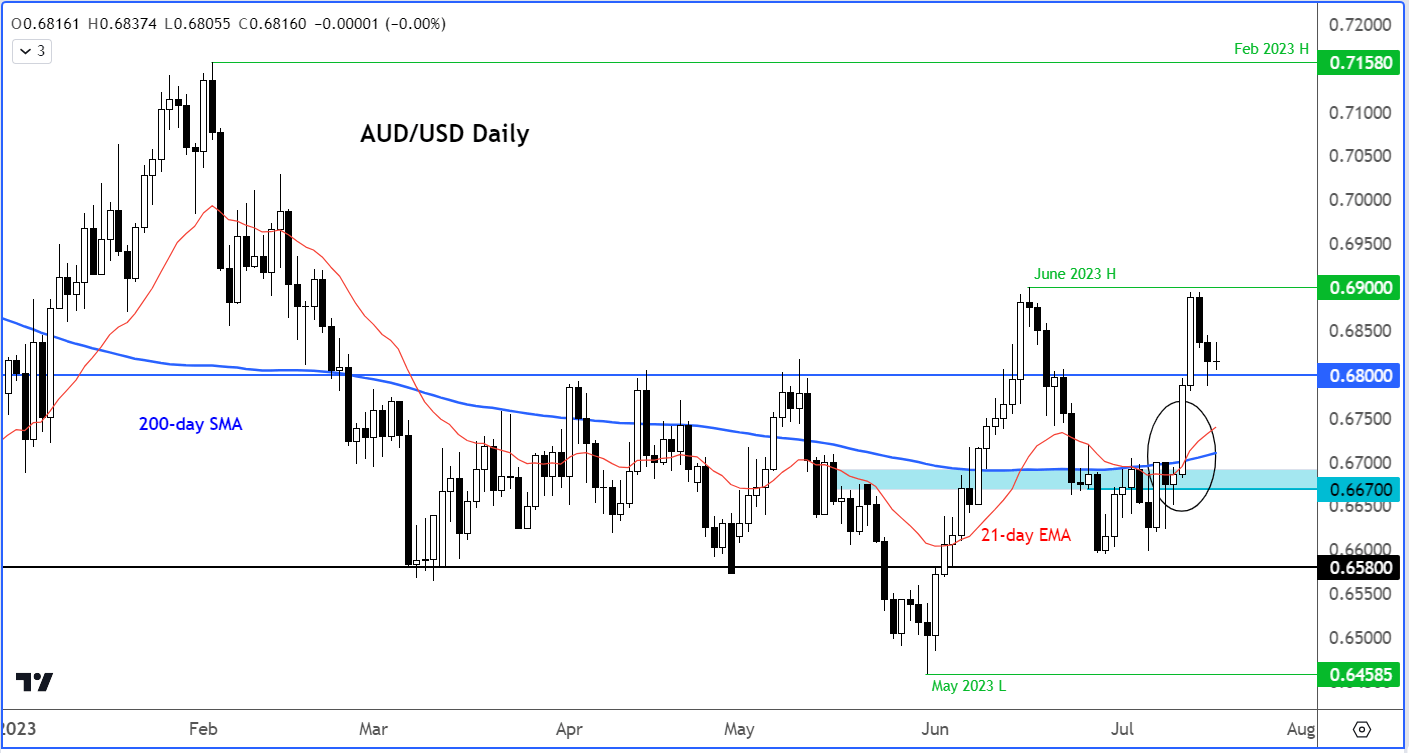
The AUD/USD was testing support around 0.6800 at the time of writing. A close below this level could pave the way for a drop back to the base of the breakout around 0.6700 area where we also have the 200-day average coming into play. However, the bulls will be eying a “buy” signal here, in light of recent bullish price action to brighten the technical AUD/USD outlook. If support holds, then the bulls will initially target the pool of liquidity resting above the June high at 0.6900.
Meanwhile, the RBA’s July meeting minutes were released overnight, but failed to lift the Aussie, even if they were a tad more hawkish than their July statement. According to my Aussie colleague Matt Simpson, “the RBA minutes have served as a timely reminder that the RBA could still hike at their next meeting, depending on which way the incoming data swings and its impact on staff forecasts. Of particular interest will be Thursday’s employment report and the monthly and quarterly inflation reports next week where hot prints keep the pressure on for another hike.”
NZD/USD outlook: Bulls failing to show up after last week’s breakout
The NZD/USD has also struggled like the Aussie, failing to get past that sticky resistance range around 0.6380 to 0.6415 last week. The bullish trend is losing momentum again, which is not a great sign for those who went long last week. So, the bulls will need to show up and soon, if they want to maintain control in this market. A bullish hammer or engulfing candle around the key 0.6300 support area is what they will be looking for now, otherwise I wouldn’t rule out a move back down to the base of the breakout and key support area circa 0.6220 next. At the time of writing, the kiwi was below this level, but the day is not over yet.
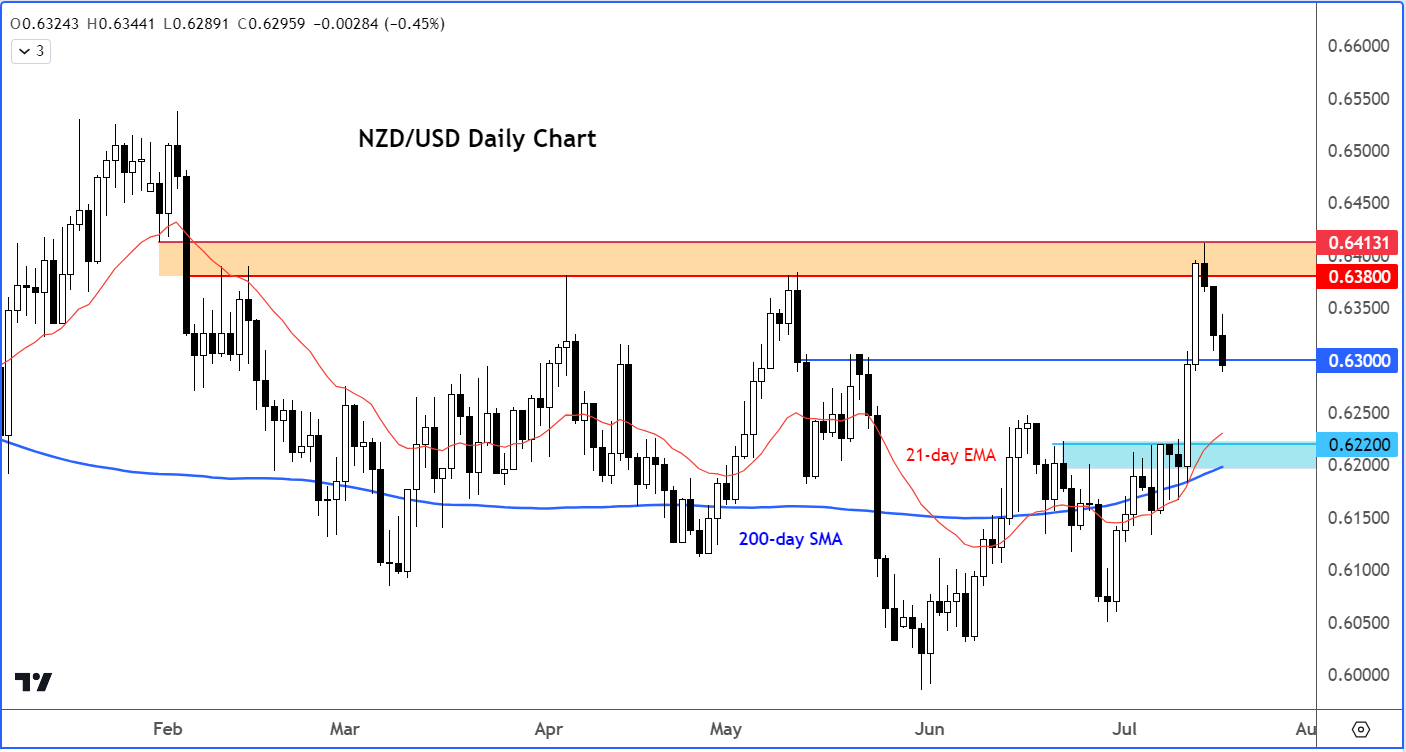
If the kiwi starts to print bullish PA again, then I would be eying a breakout above that 0.6380 to 0.6415 area next. This is not too unrealistic because of the fact the likes of the CAD, EUR, GBP and CHF have all broken to new yearly highs against USD recently. Since the kiwi was not yet showing any bullish price action, the bulls must remain patient. So, at the time of writing, the NZD/USD outlook remained as clear as mud, but all hope is not lost as we look forward to a busier macro calendar in the second half of the week.
WTI outlook: Crude oil testing base of breakout
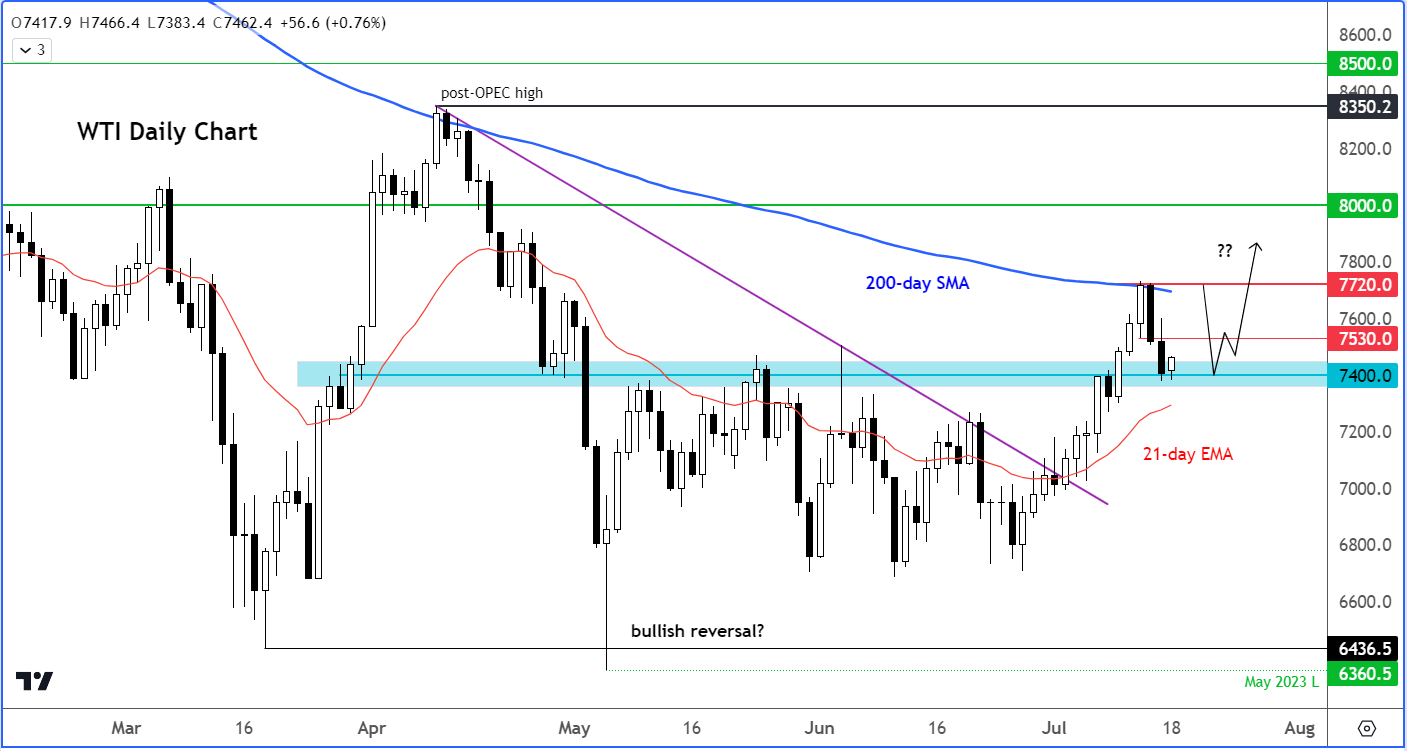
WTI crude oil failed to break above its 200-day average around $77.20 last week after a decent rally in recent weeks. But with oil prices making a couple of higher highs and higher lows since bottoming out in May, the bulls are still in overall control of price action. So, I wouldn’t be surprised if oil prices staged a recovery from around the current levels.
At the time of writing, WTI was testing key support around 74.00, the base of last week’s breakout. What the bulls will be looking for here is a bounce and hold. It might not be a bad thing if prices now consolidate below the 200-day average for a few days, in order to regain some energy and then break higher.
However, if support at around $74.00 breaks, then this would invalidate the bullish structure in the short-term outlook. In that case, a move back towards $70.00 would become likely again, as disappointed bulls exit their trades. For now, though, the WTI outlook remained mildly bullish.
Source for all charts used in this article: TradingView.com
-- Written by Fawad Razaqzada, Market Analyst
Follow Fawad on Twitter @Trader_F_R
How to trade with City Index
You can trade with City Index by following these four easy steps:
-
Open an account, or log in if you’re already a customer
• Open an account in the UK
• Open an account in Australia
• Open an account in Singapore
- Search for the company you want to trade in our award-winning platform
- Choose your position and size, and your stop and limit levels
- Place the trade
Technical analysis FAQs
What is technical analysis?
Technical analysis is a method used to evaluate financial markets using historical price data to identify trends and patterns. The theory is that previous trading activity can give insight into future price movements.
Learn more about technical analysis
How do I get the latest USD/JPY news?
You can get the latest USD/JPY news and price movements from our in-house team of experts.
Head to our news and analysis section for the most recent updates. Alternatively, you can access a live Reuters newsfeed on our trading platform.
How do you analyse DXY?
You analyse the US dollar index (DXY) in the same way you would a currency pair or stock index. The key difference is it’s not just one currency against another, but the dollar against six others. So, if the dollar is expected to decline against one – but not all – of the currencies, the DXY may not move.
Learn more about the dollar index
What does it mean if DXY goes up?
If the US dollar index (DXY) goes up, it means that the US dollar is gaining in value compared to a basket of other global currencies. Alternatively, if the DXY falls, it means the dollar has lost strength in comparison to other currencies.
See our guide to the US dollar
What is the best indicator for GBP/USD?
Technical analysis of the British pound against the US dollar (GBP/USD) is commonly based on indicators such as moving averages and oscillators. These give traders insights into the direction and strength of trends and areas of support and resistance.
Discover the most popular technical indicators
Latest market news
Yesterday 01:39 PM
Yesterday 01:29 PM
Latest Technical Tuesday articles

April 23, 2024 04:00 PM

April 16, 2024 04:54 PM

April 9, 2024 11:30 AM

April 2, 2024 04:00 PM