


The best technical indicators can offer a huge boost to your trading, helping you identify trends, outline key levels and predict price action. But which indicators should you use as part of your trading toolkit? Find out here.
Before we run down eight of our favourite indicators, it’s worth recapping a little bit on how they work – and how to use them in your trading. Skip ahead to a specific section using the links below or read on to get started.
- How to use technical indicators
- Trying out technical indicators
- The best technical indicators
- Moving averages
- Bollinger bands
- Average directional index
- RSI
- MACD
- Stochastic oscillator
- Fibonacci retracement
- Ichimoku cloud
How to use technical indicators
To use technical indicators, you simply select your desired indicator on your market’s chart, and you’ll usually see it added automatically – either onto the chart itself (if it is an overlay) or as an extra box below (if it is an oscillator).
Learn more about the types of indicators in the City Index Academy.
However, in practice trading with indicators is a little more complex than that. There are dozens of different options to choose from, aWhatnd the information you’re presented with can seem bewildering at first.
Once you’ve learned about the main technical indicators, though, you’ll see that there’s a lot of overlap in what they’re used for. So, to get to grips with trading using these nifty tools, we’d recommend learning how our eight top options work below and then putting them to the test for yourself.
Many traders choose to build a strategy using multiple indicators at once. This is useful because indicators can often deliver false signals – when, for instance, an indicator says an uptrend is imminent, but it never arrives. By using multiple tools, you can confirm a signal before you trade, helping ensure that you’re not caught out when one isn’t quite right.
Trying out technical indicators
You don’t have to risk capital when you’re testing technical indicators. Sign up for a City Index demo, and you can run through our list below and see how each works in action using virtual funds.
Then, when you’re ready, you can open a live account by following these steps:
- Complete our online application form – it usually takes less than five minutes
- Add some funds, so you can start trading instantly
- Log in to our platform and choose your markets
- Load up our advanced charts with your preferred technical tools
- Start trading
The best technical indicators for every strategy
Here are eight of the best technical indicators to use as you build your own trading strategy.
- Moving averages
- Bollinger bands
- Average directional index
- RSI
- MACD
- Stochastic oscillator
- Fibonacci retracement
- Ichimoku cloud
We might touch on the calculations for some of these indicators below – but don’t worry, you don’t need to be an expert mathematician to use them. The City Index platform automatically generates all the technical indicators you’ll need.
1. Moving averages (MAs)
Best for: Checking a market’s overall trend in an instant
Moving averages take a market’s overall movement over a set number of periods and average it out. Then they plot that average as a line overlay onto your chart, updating as the market’s current movement changes the average.
The resulting line is a useful way of cutting out the ‘noise’ of short-term volatility on a chart to see the overall price trend. You can set the parameters for the moving average yourself, by deciding how many periods it should average out.
MAs are lagging indicators, because they need a set amount of previous price action for the average calculation. The more periods you add into the calculation, the more they’ll run behind the current price – but the more noise you’ll cut out, making long-term MAs (such as 100-day or 200-day averages) useful for analysing major trends.
Learn more about moving averages.
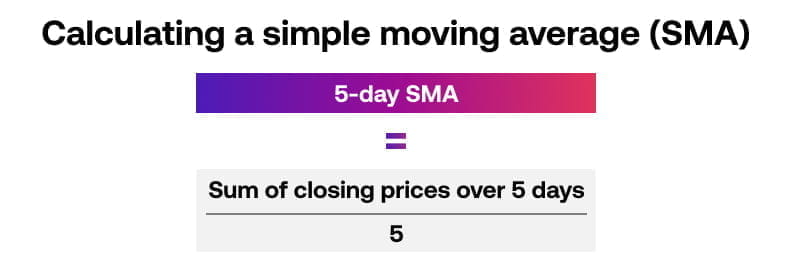
SMAs vs EMAs
There are two types of moving averages you’ll encounter as you trade: simple moving averages and exponential moving averages.
- SMAs work as we cover above, by averaging a market’s price over a set number of periods
- EMAs are a little bit more complex to calculate, as they place more importance on recent price action
Finding trades with MAs
We’ve covered using MAs to analyse trends so far here, but like most technical indicators they have several different uses for traders. For example, you can use two MAs to find buy and sell opportunities.
How? By adding a long and a short-term MA onto your chart and watching for crossovers. When the short-term line crosses above the longer-term one, it may signal the beginning of a new uptrend, meaning a chance to buy. If it crosses below, on the other hand, a downtrend could be on the cards.
2. Bollinger bands
Best for: Getting a quick gauge of volatility
Bollinger bands also appear as lines on a chart, but instead of average price action, they show how volatile the market is. They also use a moving average, but plot bands two standard deviations above and below it.
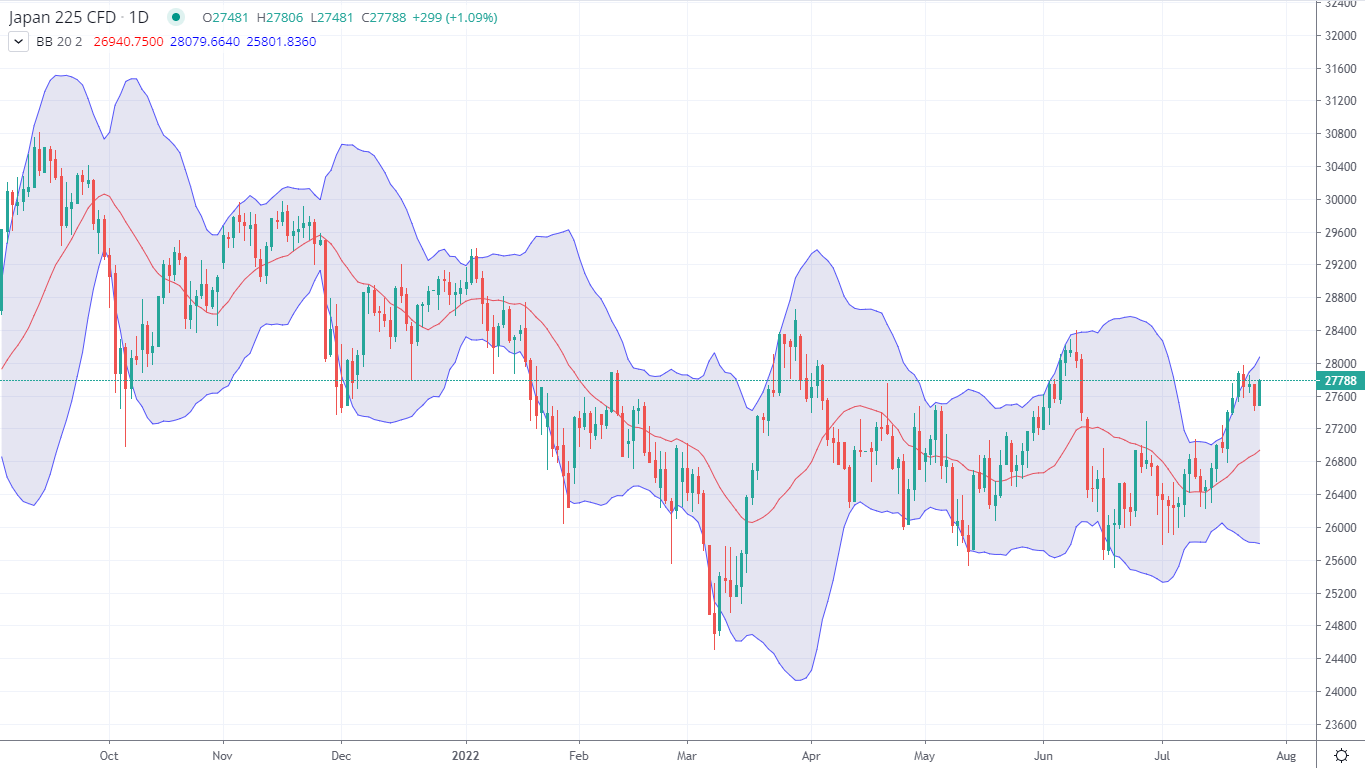
Standard deviation is a mathematical measure of variance – and by using it Bollinger bands can tell you how much the MA has deviated from its ‘normal’ price over the given period. When the bands are far apart, the market is highly volatile. When they are close together, it is calm.
Explore how to calculate Bollinger bands.
Trading with Bollinger bands
As with MAs, traders don’t only use Bollinger bands to understand volatility. They’re also used as a signal of whether a market is overbought or oversold, which can offer hints about future price action.
When a market’s current price continually tests the upper band – or even exceeds it – it’s a sign that it may be entering overbought territory, with a potential downtrend coming. If it moves towards or beyond the lower band, it may be oversold and close to bouncing upwards.
However, none of these are concrete signals. The move may never arise, and even if it does the Bollinger bands won’t tell you when. So, as with every other indicator we cover here, confirming before you trade is essential.
3. Average directional index (ADX)
Best for: Measuring the strength of a trend
The average directional index comprises of a line – called the ADX line – that appears below a chart, and uses calculations derived from recent price action to tell you the strength of a market’s current trend.
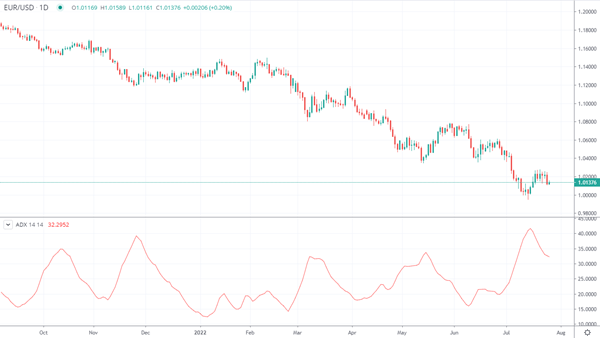
The higher the ADX line, the stronger the current trend is. Anything above 25 is seen as a strong trend, whereas anything below 20 is seen as a weak or non-existent trend.
Sometimes, you may see two other lines alongside the ADX. These are the positive and negative directional indicators, and tell you the current direction of momentum. If the positive indicator is above the negative one, the market is trending upwards; if the negative indicator is higher then it is trending downwards.
If they’re close together, or keep crossing, then the trend is probably weak.
4. Relative strength index (RSI)
Best for: Identifying momentum and market conditions
Like the ADX, the relative strength index is an oscillator that helps you understand a market’s current momentum. But instead of measuring the strength of a trend, it tells you whether the asset is currently overbought or oversold.

The RSI compares the average gains a market made on days when it closed up to losses made on days it closes down. Then, it plots this as a number between 0-100. The general idea is that bull markets should have strong up days than down, and bear markets should have the opposite.
Trading with the RSI
The simplest reading of the RSI is that a market is overbought when it is above 70, and oversold when it is below 30. However, as we’ve seen with Bollinger bands, that doesn’t necessarily mean a reversal is imminent.
One way of reducing false signals is to match the RSI’s reading to the current trend. Strongly trending markets can often remain in overbought or oversold territory for some time, so a reading above 70 or below 30 on a trending market might not mean as much.
Another popular use of RSI is to watch for divergences. These occur when price action moves in one direction, but the RSI moves in another. For example, if the RSI hits a new low and then moves upwards, but price action continues moving to new lower lows, it may be a signal of an impending bullish reversal.
5. MACD
Best for: Signalling incoming trends
The moving average convergence divergence (MACD) indicator is an oscillator that is comprised of two lines, both derived from calculations based on two moving averages: typically, a 26-period EMA and a 12-period SMA.
- The MACD line is calculated by subtracting the EMA from the SMA
- The signal line is a 9-day SMA of the MACD line
Trading with MACD
The concept here is similar to the moving average crossovers we discussed above, but instead of using two MAs we’re using the MACD line and the signal line. When the MACD line crosses above the signal line, it is seen as a sign that an uptrend may be forming. If it crosses below, a downtrend might be on the way.

The difference between the MACD and the signal line is also key. When the MACD is far above its MA, it is an indicator of a strong uptrend – or a strong downtrend when it is far below. Often, you’ll see MACD displayed with a histogram to make checking this easier.
Discover more ways to trade with MACD.
6. Stochastic oscillator
Best for: Confirming broad trends – and finding opportunities in them
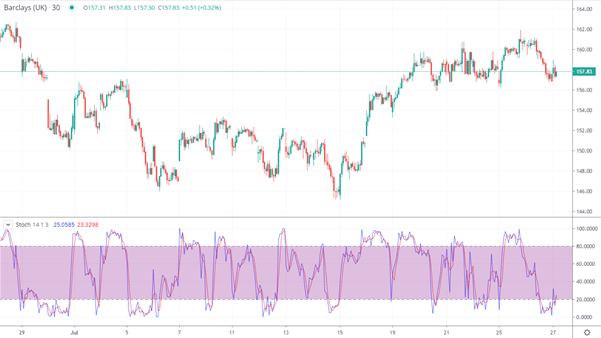
The final oscillator in our list is the stochastic, which works in a slightly similar way to the RSI. However, instead of comparing up days to down days, it calculates a market’s most recent closing price to its highs and lows. When the stochastic is high, it means the market is near the top of its range. When it is low, it is near the bottom.
As with other oscillators, the stochastic produces this calculation as a number between 0-100, which can be used to identify overbought and oversold conditions. This time, a figure above 80 is overbought while below 20 is oversold.
However, the stochastic oscillator also comes with a signal line, often called the %D (the main line is called the %K). The %D is a short-term moving average of the %K.
Generally, the stochastic is seen as a more effective tool in broad, slower moving trends. The RSI is seen as better for rapid price movement.
Trading with the stochastic oscillator
There are lots of different ways to trade with the stochastic. The simplest, unsurprisingly, is to buy when the %K is below 20 or sell when it is above 80. But again, remember that markets can remain overbought or oversold for long periods of time, and may never correct according to the signal.
As with MACD, many traders also look for crossovers – when the %K moves above or below the %D, it may signal an oncoming trend. And as with RSI, you can use the stochastic to look for divergence.
Find out more about the difference between RSI and the stochastic.
7. Fibonacci retracement
Best for: Identifying possible future support and resistance levels
Fibonacci ratios pop up in almost everything mathematical – and trading is no different.
These percentage figures are derived by dividing the numbers on the Fibonacci sequence together in different ways, and many traders use them to predict possible future retracements after strong price action.
The Fibonacci retracement indicator is essentially a drawing tool. You select a recent high and low on a market’s chart, and it plots several lines at key Fibonacci levels: typically 23.6%, 38.2%, 61.8% and 78.6%, although others are often included too.

Trading with Fibonacci retracement
Most traders use the Fibonacci retracement tool to predict possible levels of support or resistance after a major move.
Say, for example, that the FTSE 100 falls 100 points before bouncing back. You might expect the retracement to reverse back into a downtrend at 23.6, 38.2 or 61.8 points – by drawing the Fibonacci retracement using the high and low of the 100-point move, you’d see those levels outlined on your chart.
Take a look at our EUR/GBP chart above and you can see this in action – the pair makes an initial major move down, with 23.6% of that move then becoming a resistance level for the subsequent price action.
8. Ichimoku cloud
Best for: Checking trends, defining support and resistance, plus lots of other things
The Ichimoku cloud is a Japanese indicator that really works as a collection of indicators in a single tool. It consists of five lines, called the tenkan sen, kijun sen, senkou span A, senkou span B and the chikou span.

- The tenkan sen (or conversion line) is the midpoint of the market’s range over the last nine days
- The kijun sen (or base line) is the midpoint of the 26-day range
- The senkou A is the midpoint between the tenkan and the kijun
- The senkou B is the midpoint of the market’s 52-day range
- The chikou is the market’s close 26 periods ago
Both the senkou A and B are then plotted 26 periods in the future, so the Ichimoku runs ahead of current price action.
The area between the senkou A and B lines is filled to form the ‘cloud’ from the indicator’s name. When A is above B, the cloud is green; when A is below B the cloud is red.
Trading with the Ichimoku cloud
The Ichimoku sounds complex, but like Japanese candlesticks it displays a lot of information at a glance. Generally, when price is above the cloud, a market is in an uptrend. When it is below, it is in a downtrend.
You can confirm the trend by checking the colour of the cloud: green for a bull signal, red for bear.
However, the usefulness of the Ichimoku doesn’t end there. The edges of the cloud are often seen as potential future areas of support and resistance, which can be a useful way of predicting upcoming price action.
You can also use the cloud to generate buy and sell signals, by watching for crossovers between the tenkan sen and kijun sen.
Latest market news
Yesterday 01:32 PM
Yesterday 09:35 AM
Yesterday 07:23 AM
Yesterday 04:48 AM
Yesterday 12:17 AM
July 25, 2024 10:39 PM
Latest Financial market insight articles

June 17, 2024 01:00 AM


March 26, 2024 04:11 AM

November 13, 2023 11:05 AM