


- S&P 500 analysis: Benchmark US index extends losses to third week
- Nasdaq 100 technical analysis points lower
- DAX index resides in bearish channel
Before looking at the charts, let’s quickly remind ourselves why the markets are falling.
Although off their best levels, US and global stock indices remained largely out of favour. Investors have shunned risk in recent weeks following the record-setting performance of the markets in the previous 5 months to April.
Concerns over the escalation of the situation in the Middle East is at the forefront of investors’ minds. The situation remains volatile with Israel seeking revenge for Iran’s retaliatory attacks on Saturday.
On top of this, investors are becoming increasingly worried about the rising yields on benchmark government bonds, as the odds of a June rate cut by the Fed diminishes. After starting the year by pricing in something like six rate cuts for 2024, traders are now not even sure they will get 50 basis points by December.
The balloon government debt and rising cost of financing its debt is becoming a major source of concern. The International Monetary Fund was at it today, criticising US policymakers for unsustainable fiscal policies driving the nation's recent economic success. While acknowledging its impressive performance, the IMF warned of excessive spending, risking inflation and global financial instability. Such actions, it cautioned, could elevate global funding costs, threatening long-term fiscal and financial health worldwide.
The above macro factors, as well as profit-taking by investors have caused the major indices to start breaking down some key technical levels, much to the excitement of the bears.
Video: S&P 500, Nasdaq 100 and DAX analysis
S&P 500 analysis: Benchmark US index extends losses to third week
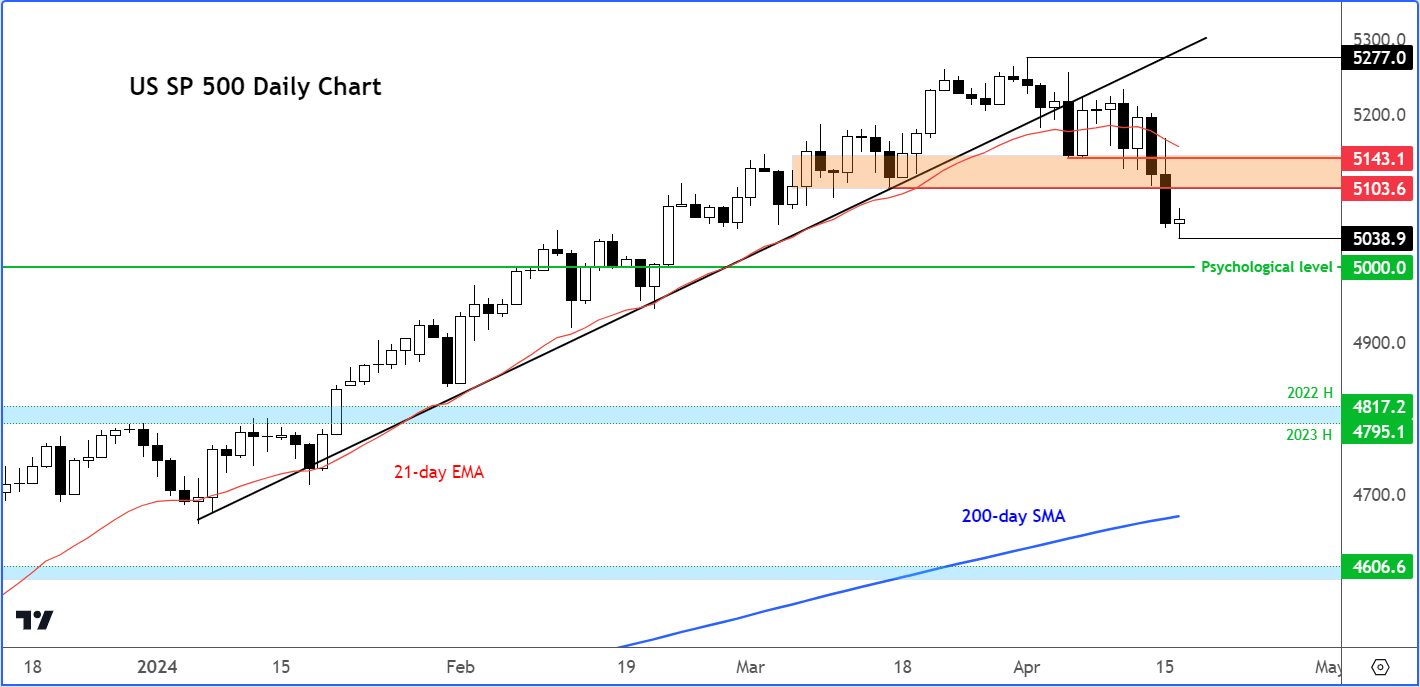
After hitting repeated new record highs, the S&P 500 is now down for the third consecutive week. On Monday, the index broke key support in the range between 5103 to 5143. This area was previously support. From here, the index could go on to drop to the psychologically-important 5000 level next. Longer term support comes in way lower between 4795 to 4817. This area marks the highs from the previous two years. On the upside, key resistance is now that the broken support area mentioned at 5103 to 5143. A close above this area is now needed to re-establish the bullish bias.
Nasdaq 100 technical analysis points lower
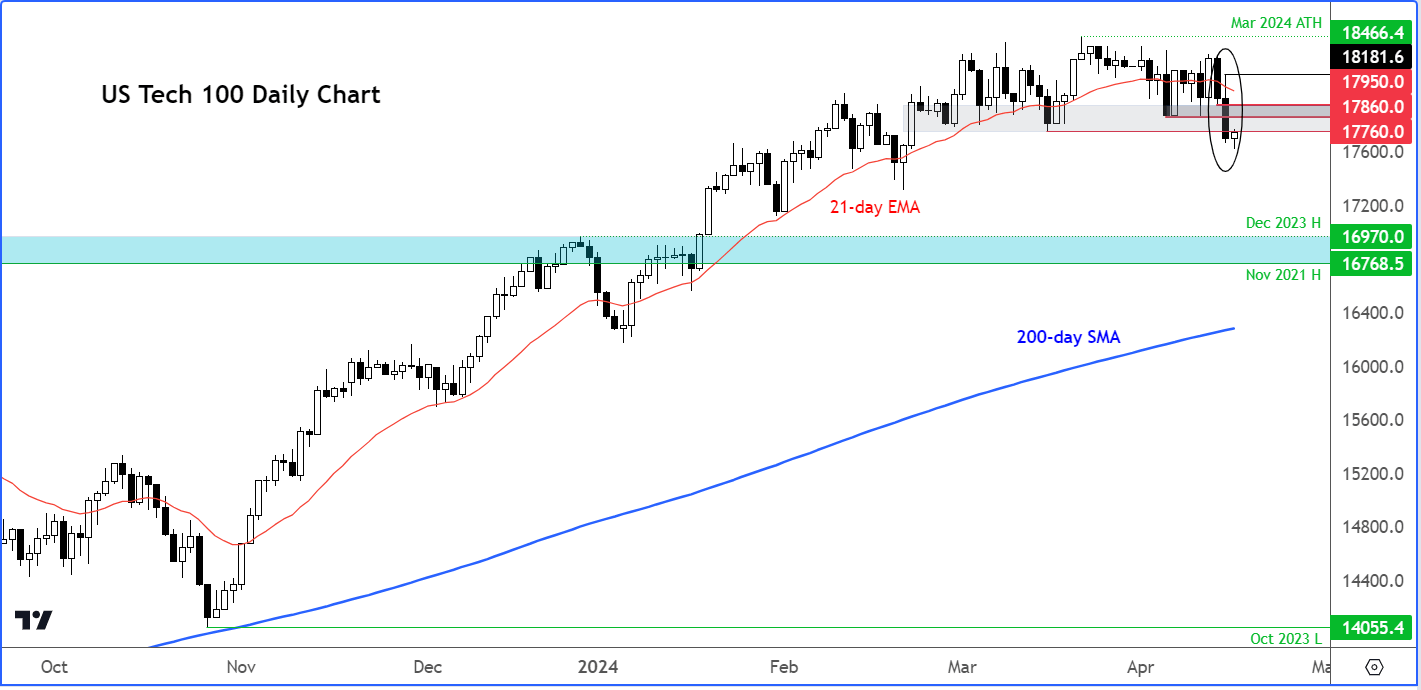
The Nasdaq broke below a key support area on Monday, causing a bearish shift in the short term trend. As you can see on the chart, prior support in the range between 17,950 to 17,860 was taken out. As a result, the index went on to break below its mid-March low of 17,760. This level was now being tested from underneath at the time of writing. It could turn into resistance, leading to a drop to a fresh monthly low. Above this level comes in that aforementioned support area which is now the most important resistance zone to watch. Should the index break above that area on a daily closing basis, this would end the bearish bias, insofar as the short term is concerned.
On the downside, there are no obvious short term support levels to watch. Perhaps 17,500 could be a target for the sellers. Below that level is the long-term support area between 16,765 to 16,970, which marks the highs from most recent years, including that of 2023. Could we fall all the way to that area is the key question? But judging by Monday's prices action, the short-term path of least resistance is now clearly to the downside, so I wouldn’t rule it out.
DAX analysis: German index resides in bearish channel
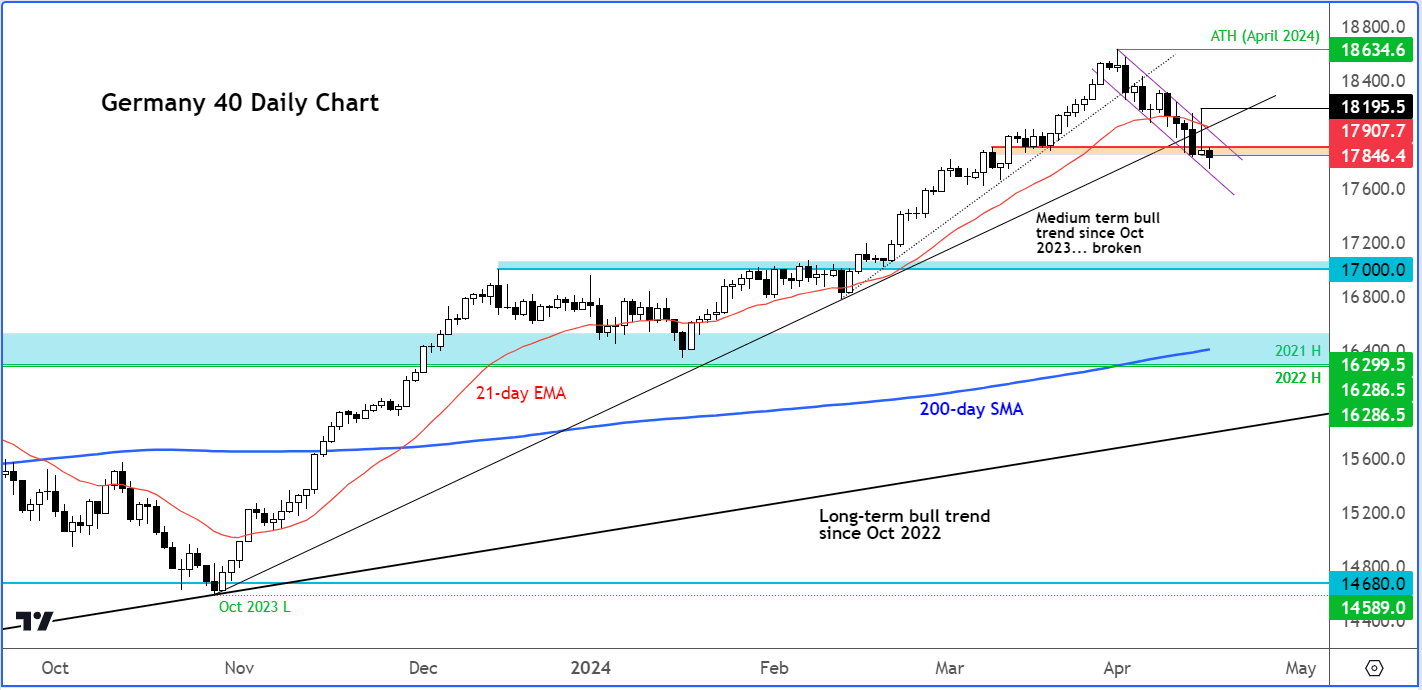
Like the S&P 500, the German DAX index is down for the third consecutive week. On Monday, it tried to rally from a key support area, around 17,850 to 17,910. Despite its efforts and momentarily breaking above the 21 day exponential moving average, it could not hold onto its gains, as raised geopolitical concerns caused the markets to drop. The index then closed around where it had opened the day, creating what looks like a bearish inverted hammer candle, with resistance coming in from the backside of the broken medium-term bearish bullish trend line that had been in place since October of 2023. Additionally, the 21-day exponential moving average offered further resistance around the top of the bearish channel in which the index is now residing in.
At the time of writing, the index was off its earlier lows, finding modelled support from the support trend of the bearish channel. But for as long as that 17,850 to 17,910 area now holds as resistance, the path of these resistance will remain to the downside. A close back above this region is needed to turn the tide back in the bulls’ favour, and ideally a move above the resistance trend of the bearish channel.
Source for all charts used in this article: TradingView.com

-- Written by Fawad Razaqzada, Market Analyst
Follow Fawad on Twitter @Trader_F_R
How to trade with City Index
You can trade with City Index by following these four easy steps:
-
Open an account, or log in if you’re already a customer
• Open an account in the UK
• Open an account in Australia
• Open an account in Singapore
- Search for the company you want to trade in our award-winning platform
- Choose your position and size, and your stop and limit levels
- Place the trade
Latest market news
Yesterday 01:32 PM
Yesterday 09:35 AM
Yesterday 07:23 AM
Yesterday 04:48 AM
Yesterday 12:17 AM
July 25, 2024 10:39 PM
Latest Technical Tuesday articles

July 23, 2024 05:20 PM

July 16, 2024 03:17 PM

May 14, 2024 06:00 PM
April 23, 2024 04:00 PM