


February 11, 2022 7:32 AM
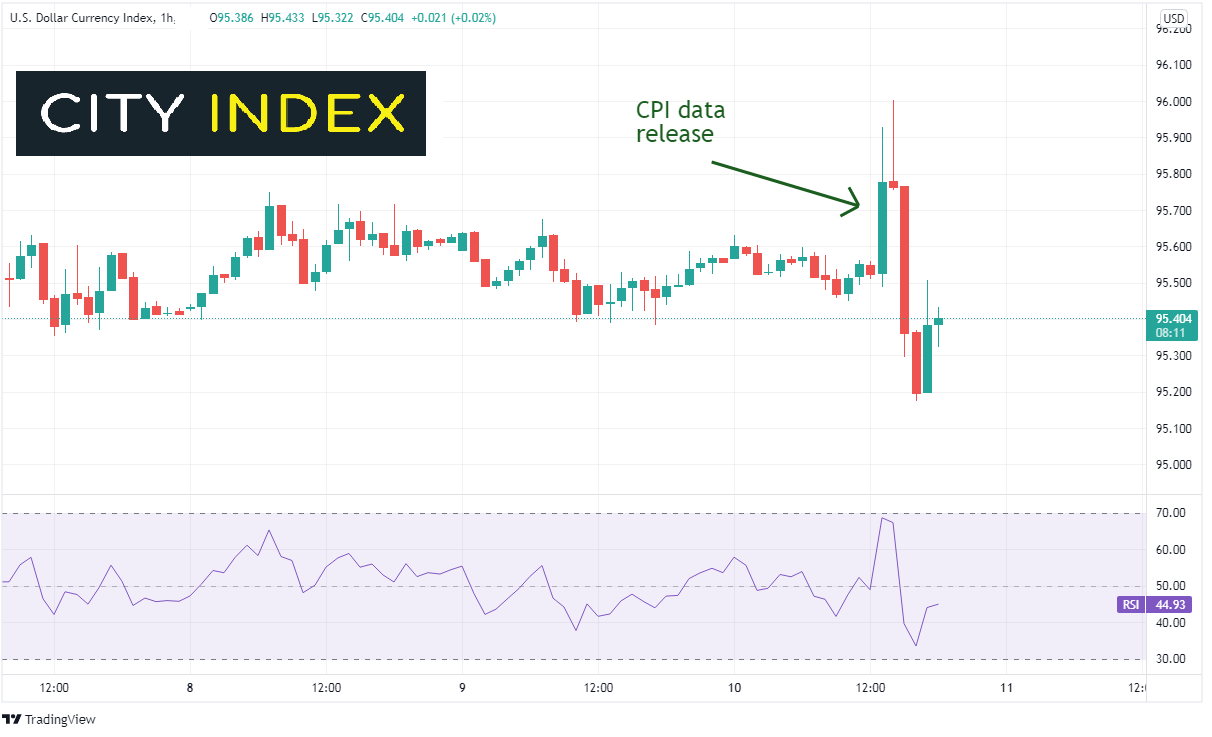
As we wrote about earlier, US CPI was 7.5% YoY vs 7.3% YoY expected and 7.0% last. Markets know that inflation is high. The government knows inflation is high. The Fed knows inflation in high. The Fed has indicated that they will hike rates at the March meeting. The only question seems to be is “Will the Fed hike 25bps or will it hike 50bps?” So, with CPI data printing higher than expected, for both the headline and the core numbers, why did the US Dollar immediately move higher upon the release, and 1 hour later reverse course and move lower?
Much of it has to do with the incremental value one receives from the high inflation data. For example, during the height of the reopening of the US economy over the summer of 2021, NFP expectations were 1,000,000+. Thus, if the actual jobs print was +1,200,000, it wouldn’t really make that much of a difference. It’s still a lot of jobs! The same can be said for the CPI data. An expectation of 7.3% YoY for CPI is high. The actual print of 7.5% is even higher. But does it matter? If inflation is 7.0% or 7.5%, it’s still relatively high. And, markets were told at the last FOMC press conference by Fed Chairman Powell that the Committee is of the mind to raise rates at the March meeting. So, today’s data, whether in-line or higher than expected, gives us little new information regarding when the Fed will raise rates.
On a 60-minute timeframe, the DXY bid up from 95.52 to a daily high of 96.00 and formed a shooting star candlestick, an indication that price could reverse. Indeed, it did move lower as traders realized that the incremental value of the data wasn’t very helpful.
Source: Tradingview, Stone X
Trade the DXY now: Login or Open a new account!
• Open an account in the UK
• Open an account in Australia
• Open an account in Singapore
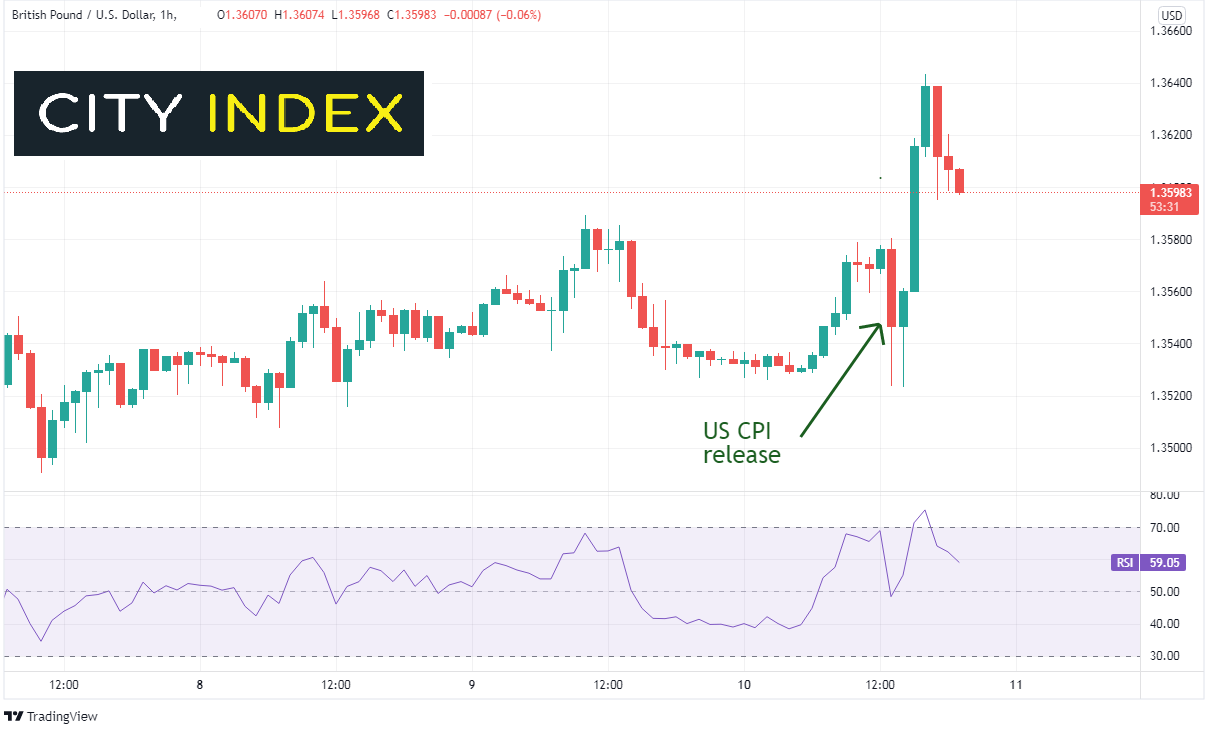
The same can be said for GBP/USD. Upon release of the US CPI, the pair moved lower from a high of 1.3580 down to 1.3524. However, GBP/USD went bid an hour later, pushing the pair to new daily highs at 1.3644, a 120 pip move off the lows.
Source: Tradingview, Stone X
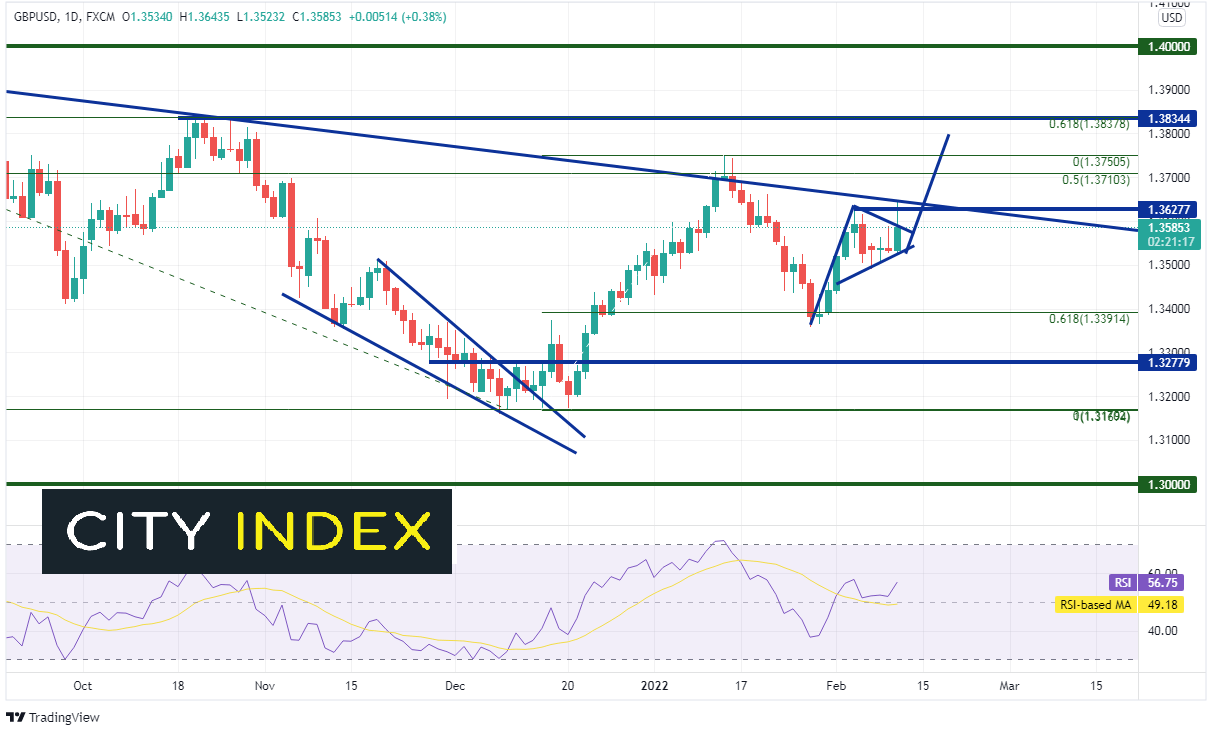
On a daily timeframe, GBP/USD had been moving higher off the recent pullback to the 61.8% Fibonacci retracement level from the lows of January 13th to the highs of January 27th, near 1.3358. GBP/USD has been consolidating in a pennant formation between 1.3490 and 1.3628 for the last 6 sessions. Upon release of the data, the pair broke out of the pennant and traded to a downward sloping trendline that dates to August 2nd, 2021. It then reversed and moved back into the pennant. Was it a false breakout?
Source: Tradingview, Stone X
Trade GBP/USD now: Login or Open a new account!
• Open an account in the UK
• Open an account in Australia
• Open an account in Singapore
The 1.3644 high for today now becomes the first resistance level (it is also the downward sloping trendline). Above there is the high from January 13th at 1.3749 and then a confluence of resistance just above the pennant target at horizontal resistance at the 61.8% Fibonacci retracement level from the highs of June 1st, 2021 to the lows of December 8th, 2021 at 1.3837. Support is at today’s low and the bottom trendline of the pennant near 1.3523, then the January 28th lows at 1.3365. If price breaks below there it can fall to horizontal support at 1.3278.
The US CPI data today was high, even higher than expected. But traders should be careful once data gets “too high”. They need to decide if the data was high enough. Incrementally, for such a reaction as we saw in the first hour after the release.
Learn more about forex trading opportunities.
Latest market news
Yesterday 03:00 PM
Yesterday 01:12 PM
Yesterday 11:14 AM
Yesterday 08:28 AM
April 24, 2024 03:30 PM
Latest Trade Ideas articles
Yesterday 03:00 PM
Yesterday 11:14 AM
April 24, 2024 11:00 AM
April 24, 2024 08:15 AM