


For those that unaware, it is a big week for central banks and therefore markets – with the RBA, BOJ, Fed, BOE and SNB on tap. We’re just hours away from the BOJ potentially exiting negative interest rates for the first time since 2016, and the FOMC are set to release their updated staff forecasts and dot plot. Volatility is certainly expected.
As we await the outcome of the BOJ’s meeting, I want to look at the relationship between commodities and the US dollar ahead of the FOMC meeting, because worrying signs are brewing.

The chart below shows the Thomson Reuters CRB core commodities index and the US dollar index. Whilst far from perfect, they generally share a positive correlation. And that is a concern because it shows commodities ripping higher ahead of the US dollar. Rising commodities are inflationary, and if inflation is set to rise then it means central banks have less wriggle room to cut interest rates.
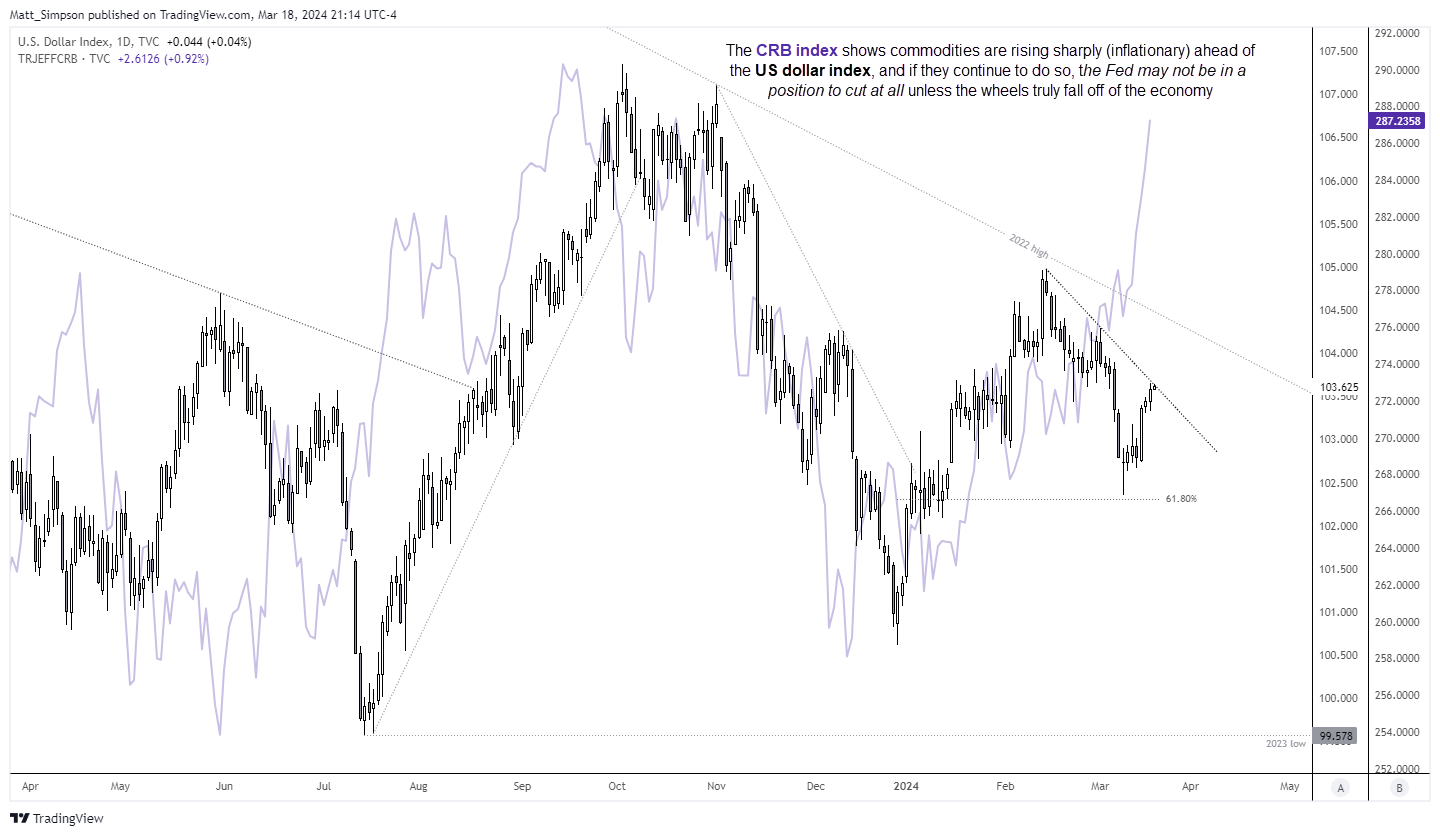
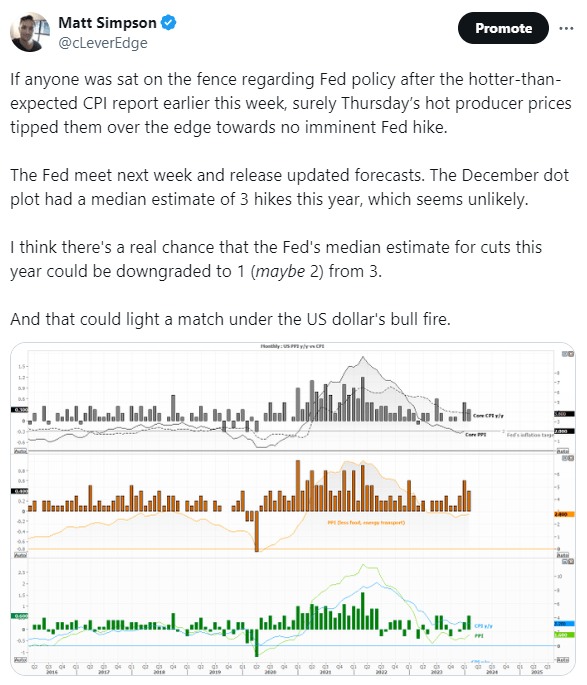
In the case of the Fed, the December ‘Dot Plot’ signalled three rate cuts this year. Yet with inflation already rising, commodities on a tare and a US election fast approaching, if the Fed are to cut at all they may need to do so sooner than later. And I find it difficult to envisage them cutting soon. And this brings with it the sobering thought that if commodities continue to rise, the Fed may not be in a position to cut rates at all this year. I’m not sure anyone really wants to hear that, but if it turns out to be correct then the US dollar looks quite undervalued.
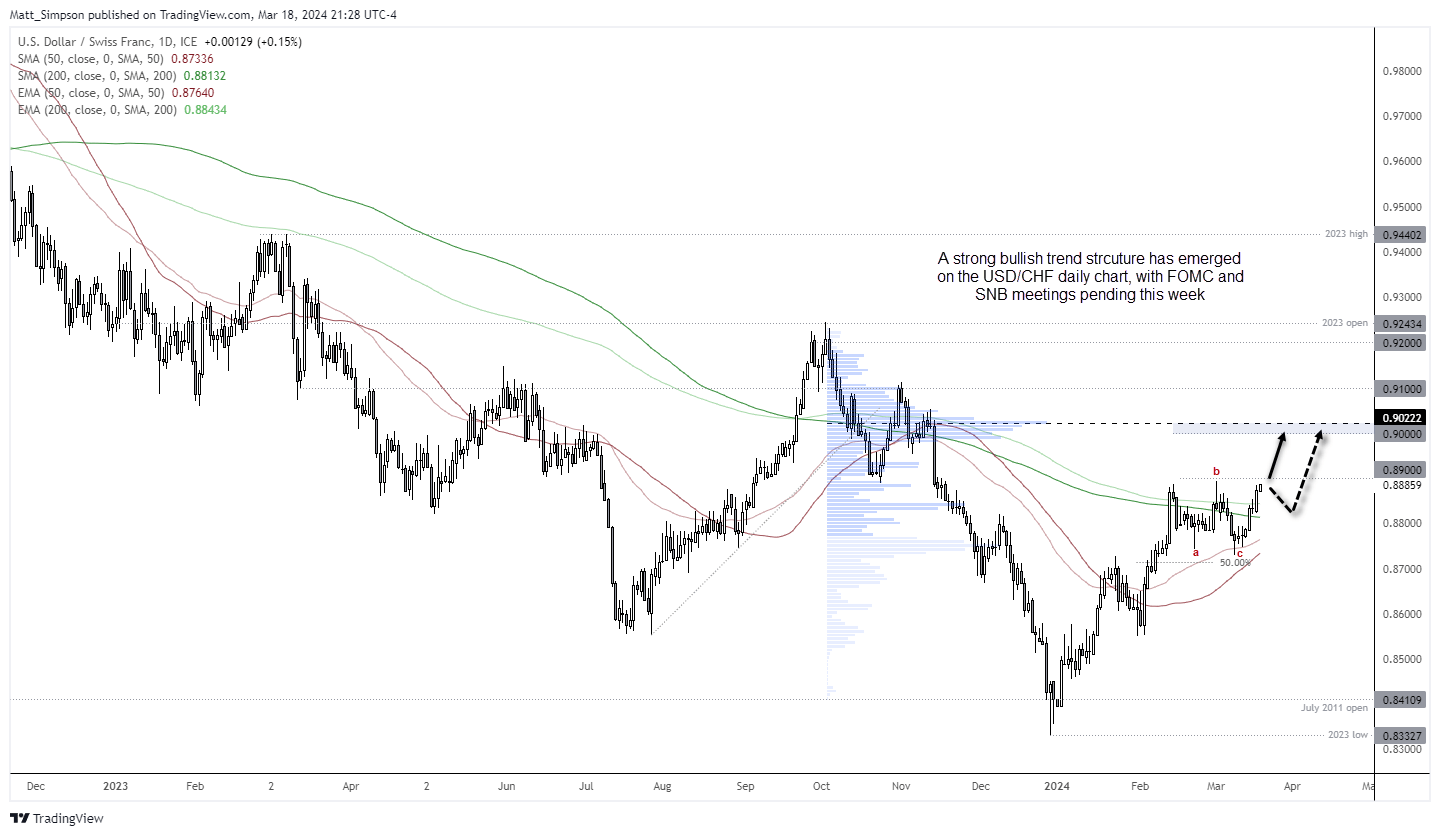
USD/CHF technical analysis:
If I had to take a long punt on the US dollar, my preference would be USD/CHF. There is a decent chance the SNB will deliver at least a dovish tone later this week (if not a surprise cut) given their undershoot with inflation, and my expectation that the Fed are in no position to be too dovish this week.
The daily chart shows a strong bullish trend structure, and prices close above the 200-day MA and EMA on Monday. The pair seems to be hesitant to break above 0.89 immediately, but the 50-day EMA has provided support and a 3-wave retracement against an impulsive move higher has occurred. From here, bulls could seek to buy dips or wait for a break above 0.8900 to bring 0.9000 into focus, near the high-volume node from the prior trend.
-- Written by Matt Simpson
Follow Matt on Twitter @cLeverEdge
How to trade with City Index
You can trade with City Index by following these four easy steps:
-
Open an account, or log in if you’re already a customer
• Open an account in the UK
• Open an account in Australia
• Open an account in Singapore
- Search for the market you want to trade in our award-winning platform
- Choose your position and size, and your stop and limit levels
- Place the trade
Latest market news
April 25, 2024 03:09 PM
April 25, 2024 03:00 PM
April 25, 2024 01:12 PM
Latest Trade Ideas articles


April 25, 2024 03:00 PM

April 25, 2024 11:14 AM
April 24, 2024 11:00 AM