


August 25, 2022 1:11 AM
Mexico released its mid-month inflation report for August earlier today and inflation rates continue to rise. The headline print was 8.62% YoY vs an expectation of 8.52% YoY and a reading of 8.16% YoY in July. This was the highest inflation reading for Mexico since the early 2000s. In addition, the mid-month Core Inflation Rate for August was 7.97% YoY vs 7.8% YoY expected and a July reading of 7.56% YoY. This was the highest reading since December 2000. The Central Bank of Mexico (Banxico) targets 3% inflation. Recall that at the last Interest Rate Decision meeting, the Central Bank hiked rates by 75bps to bring the key rate to 8.5%, citing ongoing inflationary pressures. In addition, the Banxico revised its inflationary outlook higher to Q3 2023 but said it expects inflation to converge at its 3% target by Q1 2024. And, as with most central banks as of late, Banxico has said that it will move to make decisions for its next rate decision based on incoming data and did not provide forward guidance for its next rate move.
On a daily timeframe, USD/MXN has been making lower highs since April 3rd, 2020, during the height of the pandemic when the pair traded as highs as 25.0457. However, the pair has formed as strong support zone between 19.5491 and 19.7063. Throughout 2022, USD/MXN has been moving is a downward sloping channel. On May 30th, the pair tested the bottom of the support zone, making a new low at 19.4136, however price held the bottom trendline of the channel. As often is the case, when price fails to breakout through one side of the pattern, it often moves to test the other side of the pattern. USD/MXN bounced above the top trendline to the 61.8% Fibonacci retracement level from the highs of November 25th, 2021 to the lows of May 30th at 21.1079, however the move failed and price moved back into the channel.
Source: Tradingview, Stone X
Trade USD/MXN now: Login or Open a new account!
• Open an account in the UK
• Open an account in Australia
• Open an account in Singapore
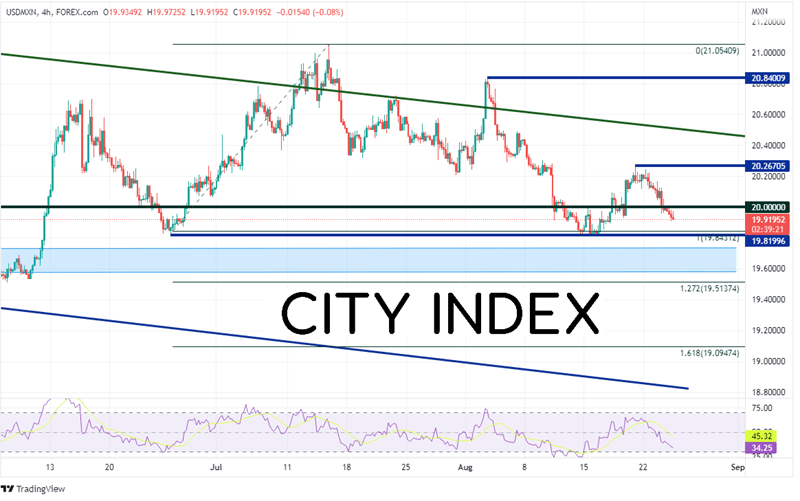
On a 240-minute timeframe, USD/MXN may be looking to move to retest the bottom trendline of the channel, which is now near 18.8292. However, if price is to get there, it must first pass through horizontal support at 19.8200, then the previously mentioned support zone between 19.5491 and 19.7063. Below there, the next support levels are the 127.2% and 161.8% Fibonacci extensions from the low of June 27th to the high of July 14th at 19.5137 and 19.0957, respectively. However, if support holds, the first resistance level is the high from August 19th at 20.2671, then the top, downward sloping channel from the longer timeframe near 20.5173. Above there, price can move to the highs of August 2nd at 20.8400.
Source: Tradingview, Stone X
Mexico’s mid-month inflation rate hit a new high for the cycle today at 8.62%, which is helping push USD/MXN lower today towards prior support. Will inflation continue to move higher? It may depend on what the Central Bank of Mexico does when it meets again at the end of September!
Learn more about forex trading opportunities.
Latest market news
Yesterday 03:00 PM
Yesterday 01:12 PM
Yesterday 11:14 AM
Latest Forex articles
April 24, 2024 03:14 PM
April 24, 2024 11:00 AM
April 23, 2024 11:09 PM