


Trend trading is a common long-term style of speculating on markets. Discover the range of different trend trading strategies and indicators you can use.
What is trend trading?
Trend trading is a strategy that involves capturing gains by looking at an asset's momentum when it’s moving in one specific direction, whether it’s up, down or sideways.
You can think of trend trading as taking the path of least resistance – if the market is rising, you’d take a long position and if it’s falling, you’d go short.
It helps to split trends up into primary and secondary movements. A primary trend describes the long-term, overarching movement. But then you have secondary trends, which are shorter-term fluctuations.
So, although some trend traders will take a broader position, you can also be a swing trader in a trending market – speculating on the smaller peaks and troughs.
Although the terms are often used interchangeably, trend following is a slightly different strategy, as the trader will attempt to ride the entire primary trend – from start to finish – rather than also finding opportunities in smaller oscillations.
How do you identify a trend?
To identify a trend, it’s common to use trendlines. These are just lines drawn onto a price chart.
There are three main types of trends:
- Uptrends
- Downtrends
- Sideways trends
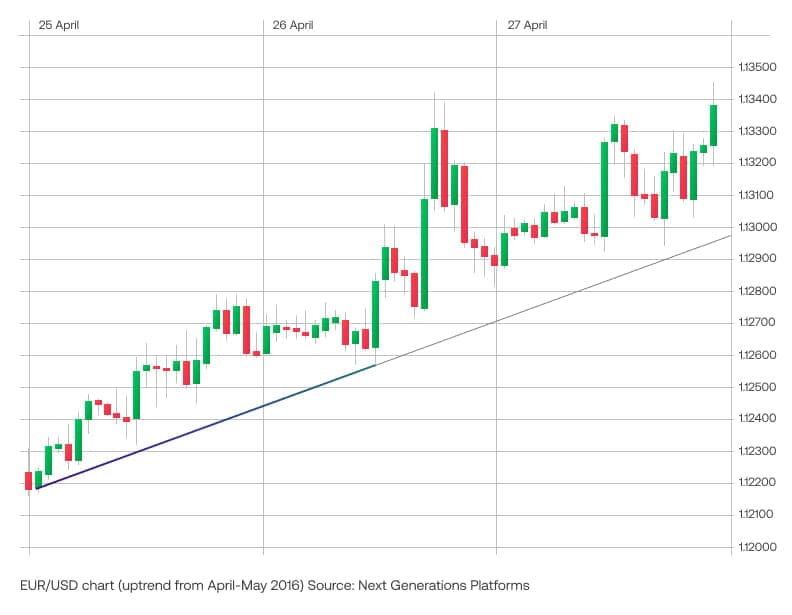
To find an uptrend, you join two low points of a chart. If the line slopes upward, you’d have an ‘uptrend’, consisting of higher highs and lower lows. In this case, traders would consider taking a long position to capture the bullish sentiment.
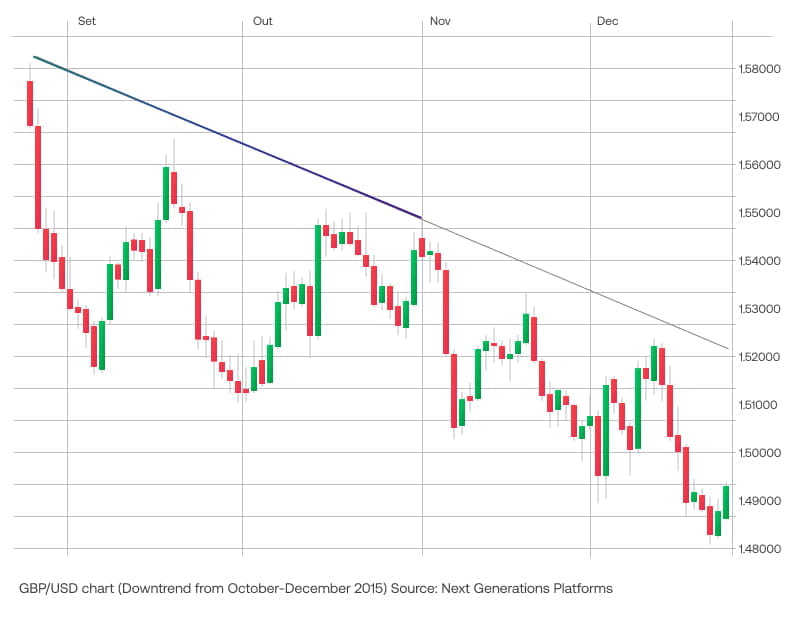
To find a downtrend, meanwhile, you’ll join two highs on a price chart. If the line slopes downward, you’d have a ‘downtrend’. It will consist of lower highs and lower lows. In this instance, traders might consider short selling the market.
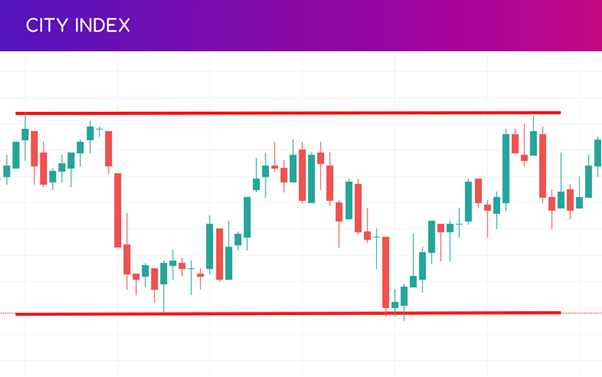
But you might join highs and lows and find horizontal lines instead. This is known as a ‘sideways trend’ or a range-bound market. Here, you could take either a long or short position to speculate on the smaller oscillations between these two lines.
How do you know when a trend is over?
The most obvious way of knowing when a trend is over is if there’s a reversal. This is when the asset’s price starts to move in the opposite direction for a sustained period. It usually occurs at a point of support or resistance.
It’s important to ensure a reversal is taking place, not just a more temporary retracement, otherwise, you could end up exiting a trade too early. You should use indicators to assess whether a market is retracing or reversing, such as the Fibonacci retracements tool.
You should always attach an exit order to your position – such as a take profit or stop loss – that would automatically close your position once a set level of profit or loss has been met. Risk management is just as important as a trading strategy when it comes to opening and closing positions.
Trend trading strategies
Trend trading strategies help set out how and when you’ll trade – identifying new trends as early as possible, confirming them, and then exiting the market before the trend reverses.
Most trading strategies use either technical analysis – such as indicators and price action – or fundamental analysis as their base. While others will utilise a combination of the two.
Although trend trading itself is considered a strategy, it’s often combined with aspects of other methods depending on the type of trend that’s taking place, and what type of analysis you want to do.
Four popular trend trading strategies are:
- Breakout trading
- Retracement trading
- Support and resistance trading
- News trading
1. Breakout trading
Breakout trading is commonly used in very strong trending markets that are continually reaching higher highs or lower lows.
The idea is to identify known levels of support and resistance – where the market has previously reversed in a trend – and look at the momentum behind the current movement. If there is strong momentum as the levels are reached, it’s likely the market will ‘break out’ of the range and a new trend will form.
2. Retracement trading
Retracement trading is more common in trends that are in the middle of strong and weak – they have some periods of momentum, but some countertrends too.
These temporary changes in direction can provide ideal entry points for traders, as they can get in at a more advantageous price and then take advantage of an ongoing trend.
Retracement traders must ensure a full trend reversal isn’t underway and attach stop losses to their positions to manage that risk.
3. Range trading
Range trading is popular when there is a weak trend, which tends to occur in sideways markets that trade between known support and resistance lines.
If you wanted to take a long position, you’d enter the market near a known level of support and exit near a known level of resistance. If you wanted to take a short position, you’d do the opposite; open at the resistance level and close it at the support.
4. News trading
News trading is focused on fundamental factors such as company earnings, macroeconomics and breaking news, which influence the public’s perception of an asset.
For example, you might decide that if a company has been profitable for four quarters in a row, it’s likely that its share price will continue rising as long as it achieves consistent returns. When it’s releasing the fourth quarter results, if they’re positive, you’d take a long position.
You’d hold your position until its earnings figures turn negative – this could be months or years in the making.
It’s far more based on fundamental analysis than indicators, so it can be more suitable for individuals who don’t want to learn about technical analysis. But it will never hurt to confirm your decisions with other tools.
Best indicators for trend trading
Popular indicators for trends include moving averages, momentum indicators such as the RSI, and Bollinger Bands.
Let’s take a look at each.
Moving averages
A moving average (MA) finds the average price of an instrument over a given timeframe – popular choices are 9 days, 14 days, 50 days, or 200 days, but you can choose what suits your strategy.
To use an MA in trend trading, you’ll look at whether the price is above or below the average. If it’s below the MA, the price will likely reverse upward into a new bullish trend, and if it’s above the MA, you’d be looking for a reversal downward into a bearish trend.
For example, if you’re looking to enter a long position, you might wait for the market to rise towards 50MA. Once the price and indicator have met, you’d then wait for a candle to close in your favour before entering on the next candle – giving the uptrend space to be confirmed.
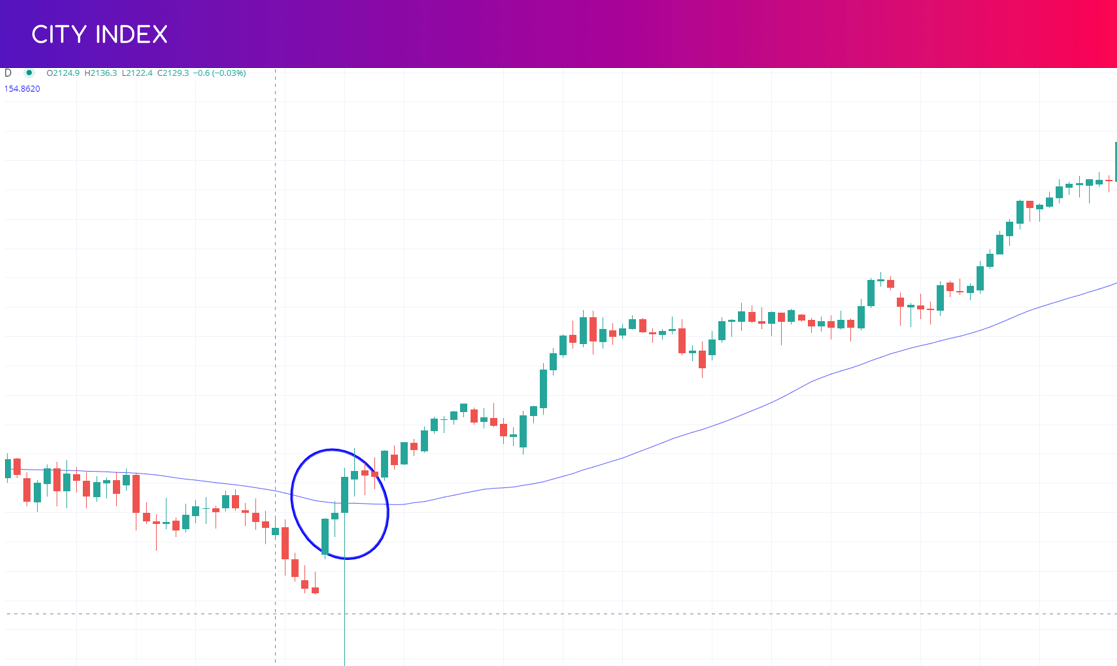
Traders would then need to set their stop loss below their entry point, to catch the trade if the market falls into a downtrend rather than rallying again.
It’s important to remember that a moving average is a lagging indicator – which means it is only showing you what has happened, rather than what is about to happen. That’s why a single MA is best used as a just part of a trading system.
A lot of traders will layer multiple MAs of different lengths onto a price chart and watch for crossovers. This strategy would wait for slower MAs and faster MAs to cross each other as buy and sell signals. For example, if a 9-day MA crosses a 21-day MA from below, it could be a signal to go long.
Relative strength index (RSI)
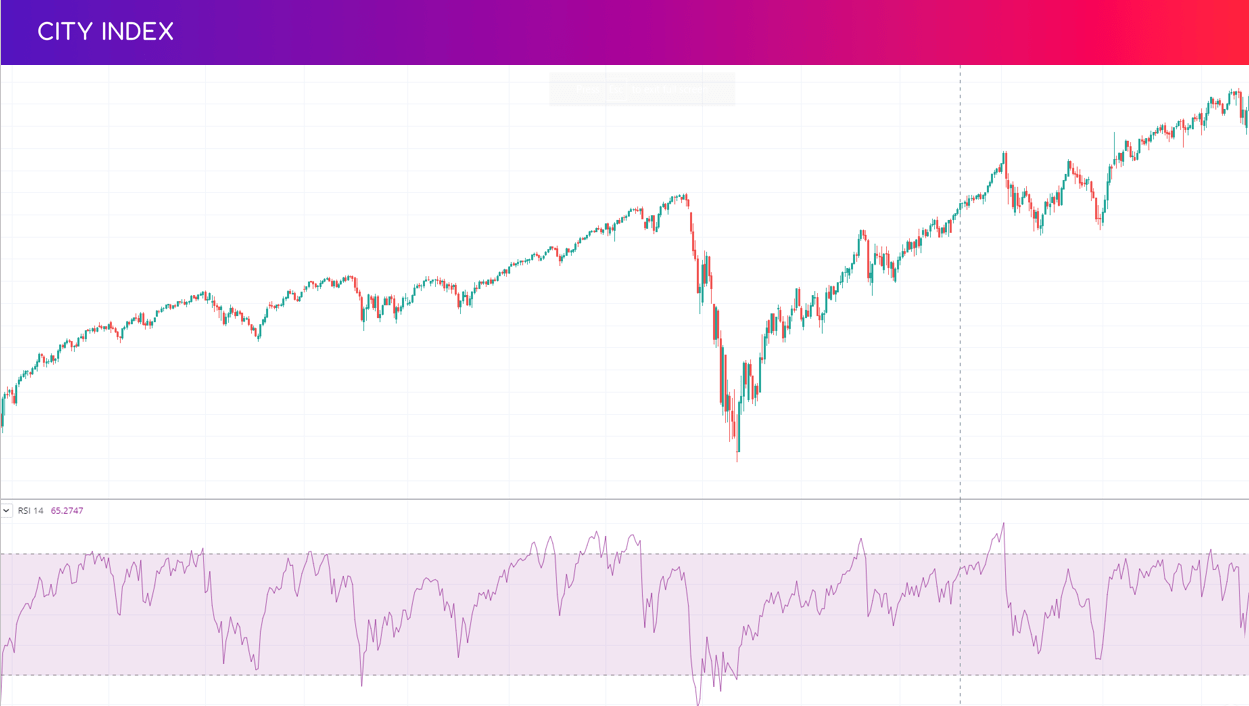
The relative strength index (RSI) is popular among trend traders as it is a momentum indicator. This means it measures the strength of certain trends, providing insights into whether there’s enough force behind the movement for it to continue, or whether it’s too weak and will reverse.
The RSI looks at the speed at which buyers are buying and sellers are selling. It measures the average days the market closes up versus the days it closes down and rates them on a scale of 1 to 100.
If the reading is below 30, it suggests the market is oversold. This usually coincides with reversal points, as more buyers take this as a sign the asset is cheap.
If the reading is above 70, it indicates the opposite. That the market is overbought, and sellers are likely to flood the market leading an uptrend to reverse.
The RSI can be used as part of a retracement strategy. If there is an uptrend, but the RSI fell below the 30 level before rising again, it could signal the overall uptrend is going to continue. The indicator shows the price has pulled back toward oversold territory but is rising again in line with the existing trend. We can see that on the below S&P 500 price chart.
As with any indicator, it’s important to understand that these signals are not 100% accurate and can provide false signals. So, it’s necessary to attach risk management tools to any positions, such as stop losses, trailing stops or guaranteed stops.
Bollinger bands
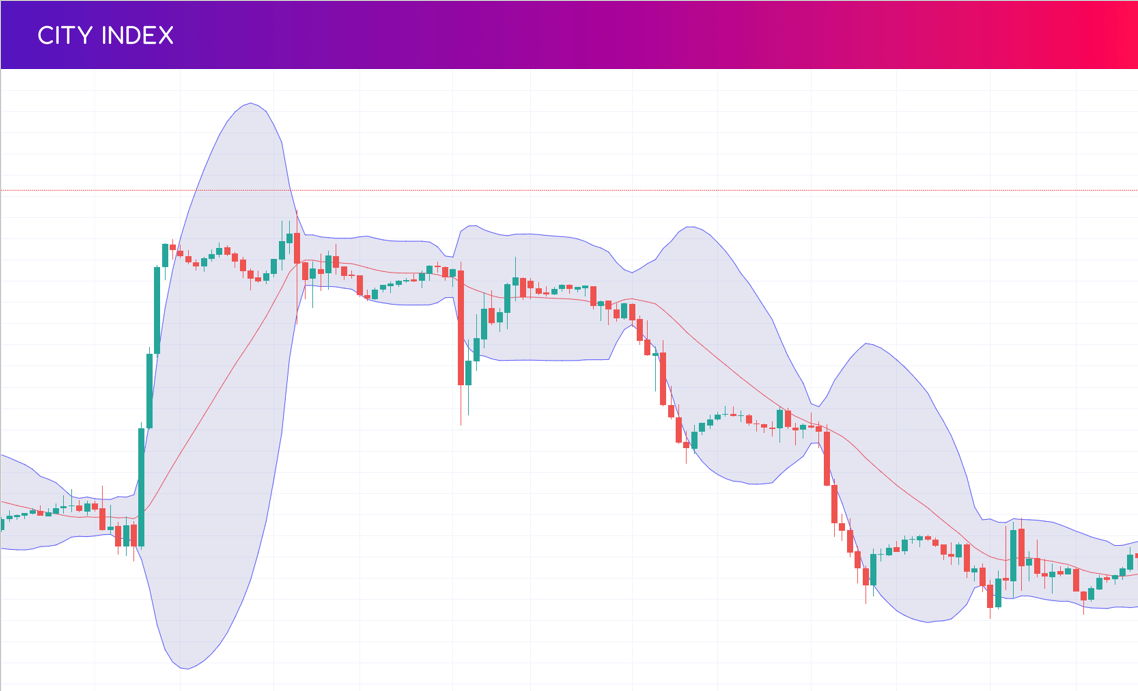
Bollinger bands are another popular tool for identifying overbought and oversold levels.
The tool is composed of three lines:
- The middle band – which is a 20-day simple moving average
- The upper band – the SMA plus twice the daily standard deviation
- The lower band – the SMA minus twice the daily standard deviation
When the price of the asset breaks below the lower Bollinger band, it can be seen as a sign that prices have fallen too low in a downtrend and a reversal into a new uptrend could be about to start.
When the price is above the upper Bollinger band, the opposite would be true: the market is overbought and due for a reversal lower. For example, in this chart, we see the price jump outside of the upper band, and a downtrend begin.
You can also use Bollinger bands in a weak trend, such as a range bound market, as the price is likely to bounce between the upper and lower bands.
A lot of trend traders will use Bollinger bands as more of a guide for entry and exit, than an indication of the direction of a trend itself. Because a market can remain overbought and oversold for long periods of time.
For example, if the trend is downward, you’d could take a short position when the upper band has been hit. But if the market is trending down and the lower band is hit, you wouldn’t open a long position until there is confirmation that the trend has reversed fully. You might still use the lower band as a guide for placing your stop loss though.
This is why it’s always important to use a combination of indicators and analysis tools to confirm signals and protect trades with risk management measures.
Trend trading with price action
The opening price and closing price of each candlestick can provide traders with a wealth of information that can be used to identify new trends and reversals of existing trends.
Focusing on a price chart, rather than attaching indicators, is what’s known as price action trading.
Common price patterns to watch out for are ascending and descending triangles, which are both continuation patterns – indicating the trend is going to keep going after a brief struggle between buyers and sellers.
An ascending triangle is found in an uptrend. It appears when a market enters a brief period of consolidation, in which the price moves create a horizontal line when the swing highs are connected and a rising trendline when the swing lows are connected. The two lines form a triangle.
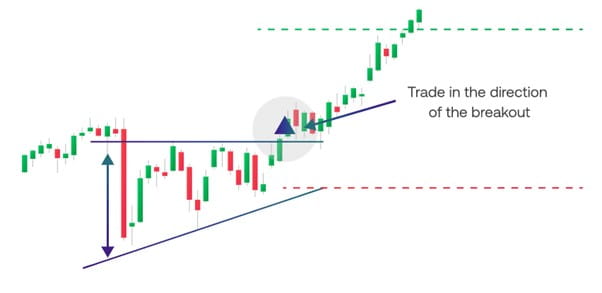
The pattern signals that the original uptrend will continue, and the price will break out from the horizontal resistance line – so you could go long. If the breakout doesn’t occur, and the market moves lower, the pattern would have failed. Traders would place a stop loss below a recent significant low to manage the risk of this.
A descending triangle pattern appears in a downtrend and shows the opposite – a flat support line when you connect the swing lows, and a sloping resistance line made by connecting the lower highs. You’d open a short position if the market breaks below the support line.
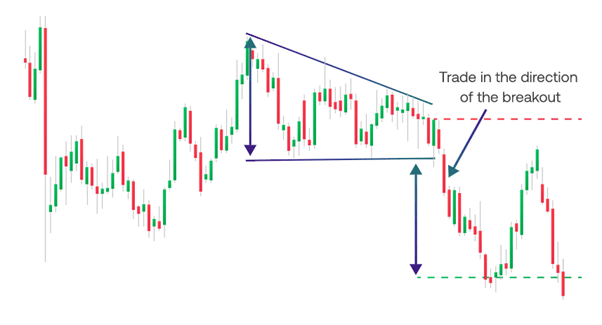
The pattern would have failed if the market breaks higher instead, and you’d place stop loss above a recent significant high.
What are the risks of trend trading?
There are some risks of trend trading you should be aware of before jumping into a position:
- Reversal risk. Trend trading relies on the assumption that recent price movements will continue in the same direction. However, there is always a risk that the trend will reverse, causing losses for traders who are caught on the wrong side of the trade
- Overbought/oversold risk. When trends continue for long periods of time, it can cause assets to become overbought or oversold, meaning that their price may be inflated or undervalued based on their underlying fundamentals. This could lead to a price correction, which can cause losses for trend traders who don’t have risk management in place
- False signals. As with any indicator-based strategy, trend trading can be vulnerable to false signals, meaning that the price movements may not accurately reflect the underlying market sentiment. This can lead to traders taking positions that are not aligned with the overall trend, resulting in losses
- Volatility risk. Although trend trading tends to look at longer-term trends, not small fluctuations, volatility in the market can still make it difficult to predict price movements and increase the risk of sudden price swings that can cause losses
You can manage your risk by using stop-loss orders that close your positions automatically at set levels of loss, and take-profit orders, which lock in any profits you may earn.
You should always start practising a new strategy first in a risk-free environment, such as a demo account.
Trend trading FAQs
What is the best timeframe for trend trading?
Trends can exist on different timeframes – you might see a downtrend on a weekly chart and an uptrend on an hourly chart. So, the best timeframe for trend trading completely depends on your specific style of trading. If you’re a position trader or investor, you might focus on weekly or monthly trends, and if you’re a scalper or day trader, you might look at hourly trends.
What is a counter-trend trading strategy?
Counter-trend trading is the strategy of predicting trend reversals, taking a position against the current trend in order to capture the change in direction. Just like trend trading, it involves the analysis of chart patterns and indicators to find opportunities.
Latest market news
Yesterday 01:32 PM
Yesterday 09:35 AM
Yesterday 07:23 AM
Yesterday 04:48 AM
Yesterday 12:17 AM
July 25, 2024 10:39 PM
Latest Insights articles

March 21, 2024 04:05 AM

February 12, 2024 02:44 PM

February 9, 2024 04:37 PM

February 8, 2024 06:25 PM