


Fed Rate Cut Key Points
- The Fed dates back more than a century to 1913, but the modern history of Fed interest rate policy started in 1982.
- On average, 1-year returns and the likelihood of a gain have both been below average for the S&P 500 and DJIA around Fed rate cuts.
- Fed rate cuts have generally been a bullish catalyst for gold prices, with average 1-year returns of +11% and 6/7 positive returns in the sample studied.
The History of the Federal Reserve and Basics of Monetary Policy
Since 1913, the Federal Reserve has played a crucial role in stabilizing the U.S. economy. The Federal Reserve Act was initially aimed at preventing bank failures and economic downturns, but the role of the central bank has evolved dramatically over the last 110+ years.
Today, the Fed’s primary focus is to maintain employment levels and control inflation through monetary policy, which includes managing interest rates and the overall money supply. As many readers know by now, lowering interest rates and increasing money supply are strategies used to stimulate economic growth, whereas raising rates can help cool down an overheating economy.
The History of Federal Reserve Interest Rates
Over the decades, the Federal Reserve has significantly refined its approach to managing interest rates, a journey marked by both challenges and evolution.
In the early years, particularly during the tumultuous period of the 1930s, the Fed's policies inadvertently contributed to the severity of the Great Depression, highlighting the critical need for a more nuanced understanding of monetary policy's impact on the economy.
Recognizing these early missteps, the Fed embarked on a path toward greater transparency and predictability in its monetary policy from the 1980s onwards. This era heralded a new approach to interest rate management, moving away from the rigid constraints of the gold standard and its successors towards a more flexible and communicative strategy.
By prioritizing the Federal Funds rate as the main lever of monetary policy, the Fed aimed to more effectively navigate the complexities of economic cycles, using rate adjustments as clear signals to the market and as a means to manage economic expectations. This strategy was aimed at mitigating inflationary pressures while supporting sustainable growth and employment. In other words, the modern history of Fed interest rates dates back to the early 1980s, with periods before that not reflecting the current reality of monetary policy.
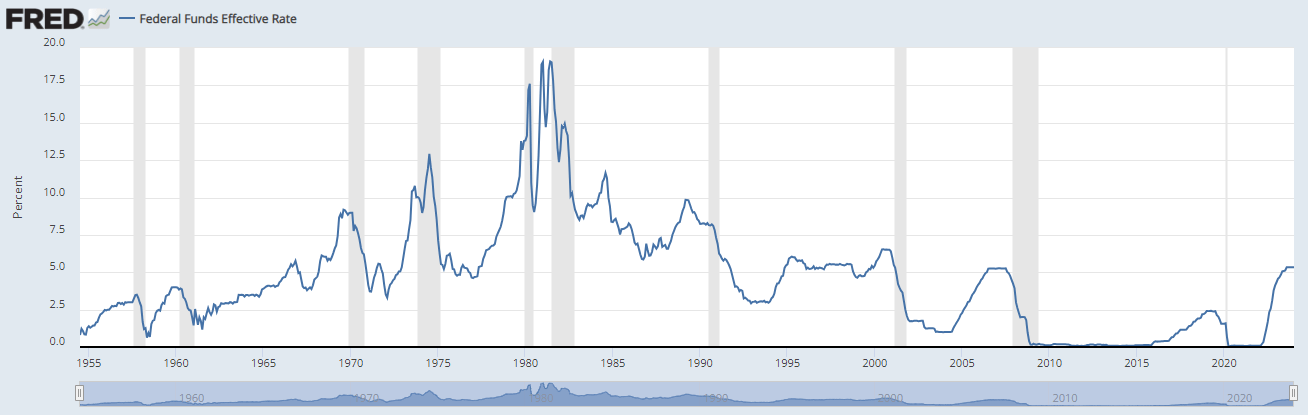
Source: FRED
The Modern History of Fed Rate Cut Cycles
With the Fed potentially entering a new phase of lowering interest rates, it's worth examining how such moves have influenced the economy and markets in the past. This involves looking at the S&P 500, DJIA, and gold prices around the start of previous rate cut cycles.
While history doesn't predict the future, it offers insights into potential market responses to Fed policies. Understanding these trends can help traders and investors avoid common misconceptions and better understand the broader implications of Fed interest rate cuts.
For the purposes of this analysis, an interest rate “cycle” is defined as a 100bps (1%) move higher or lower in interest rates. By this definition, there have been seven unique easing cycles since 1982, starting on the following dates:
- 7/1/1982
- 10/2/1984
- 5/16/1989
- 7/6/1995
- 1/3/2001
- 9/18/2007
- 7/31/2019
Impact of Fed Rate Cuts on the S&P 500
Starting with the broad S&P 500, we can observe the following developments around past Fed easing cycles:
- The S&P 500 has seen generally lower volatility leading into the first Fed rate cut of a new cycle, with returns over the prior year falling in the +15% to -10% range.
- Volatility has been much more pronounced once the Fed starts an easing cycle historically, with SPX returns over the next year ranging from -20% to +40%.
- Overall, the index rose 4/7 times (57%) in the year before and 4/7 times (57%) in the year after the first Fed rate cut of a new cycle. This is slightly below the ~70% long-term odds of the S&P 500 rising over a year.
- On average, the S&P 500 has risen 4% in the year before the Fed starts cutting interest rates and risen 7% in the year after, both below the long-term average 1-year, price-only returns of ~7-8%.
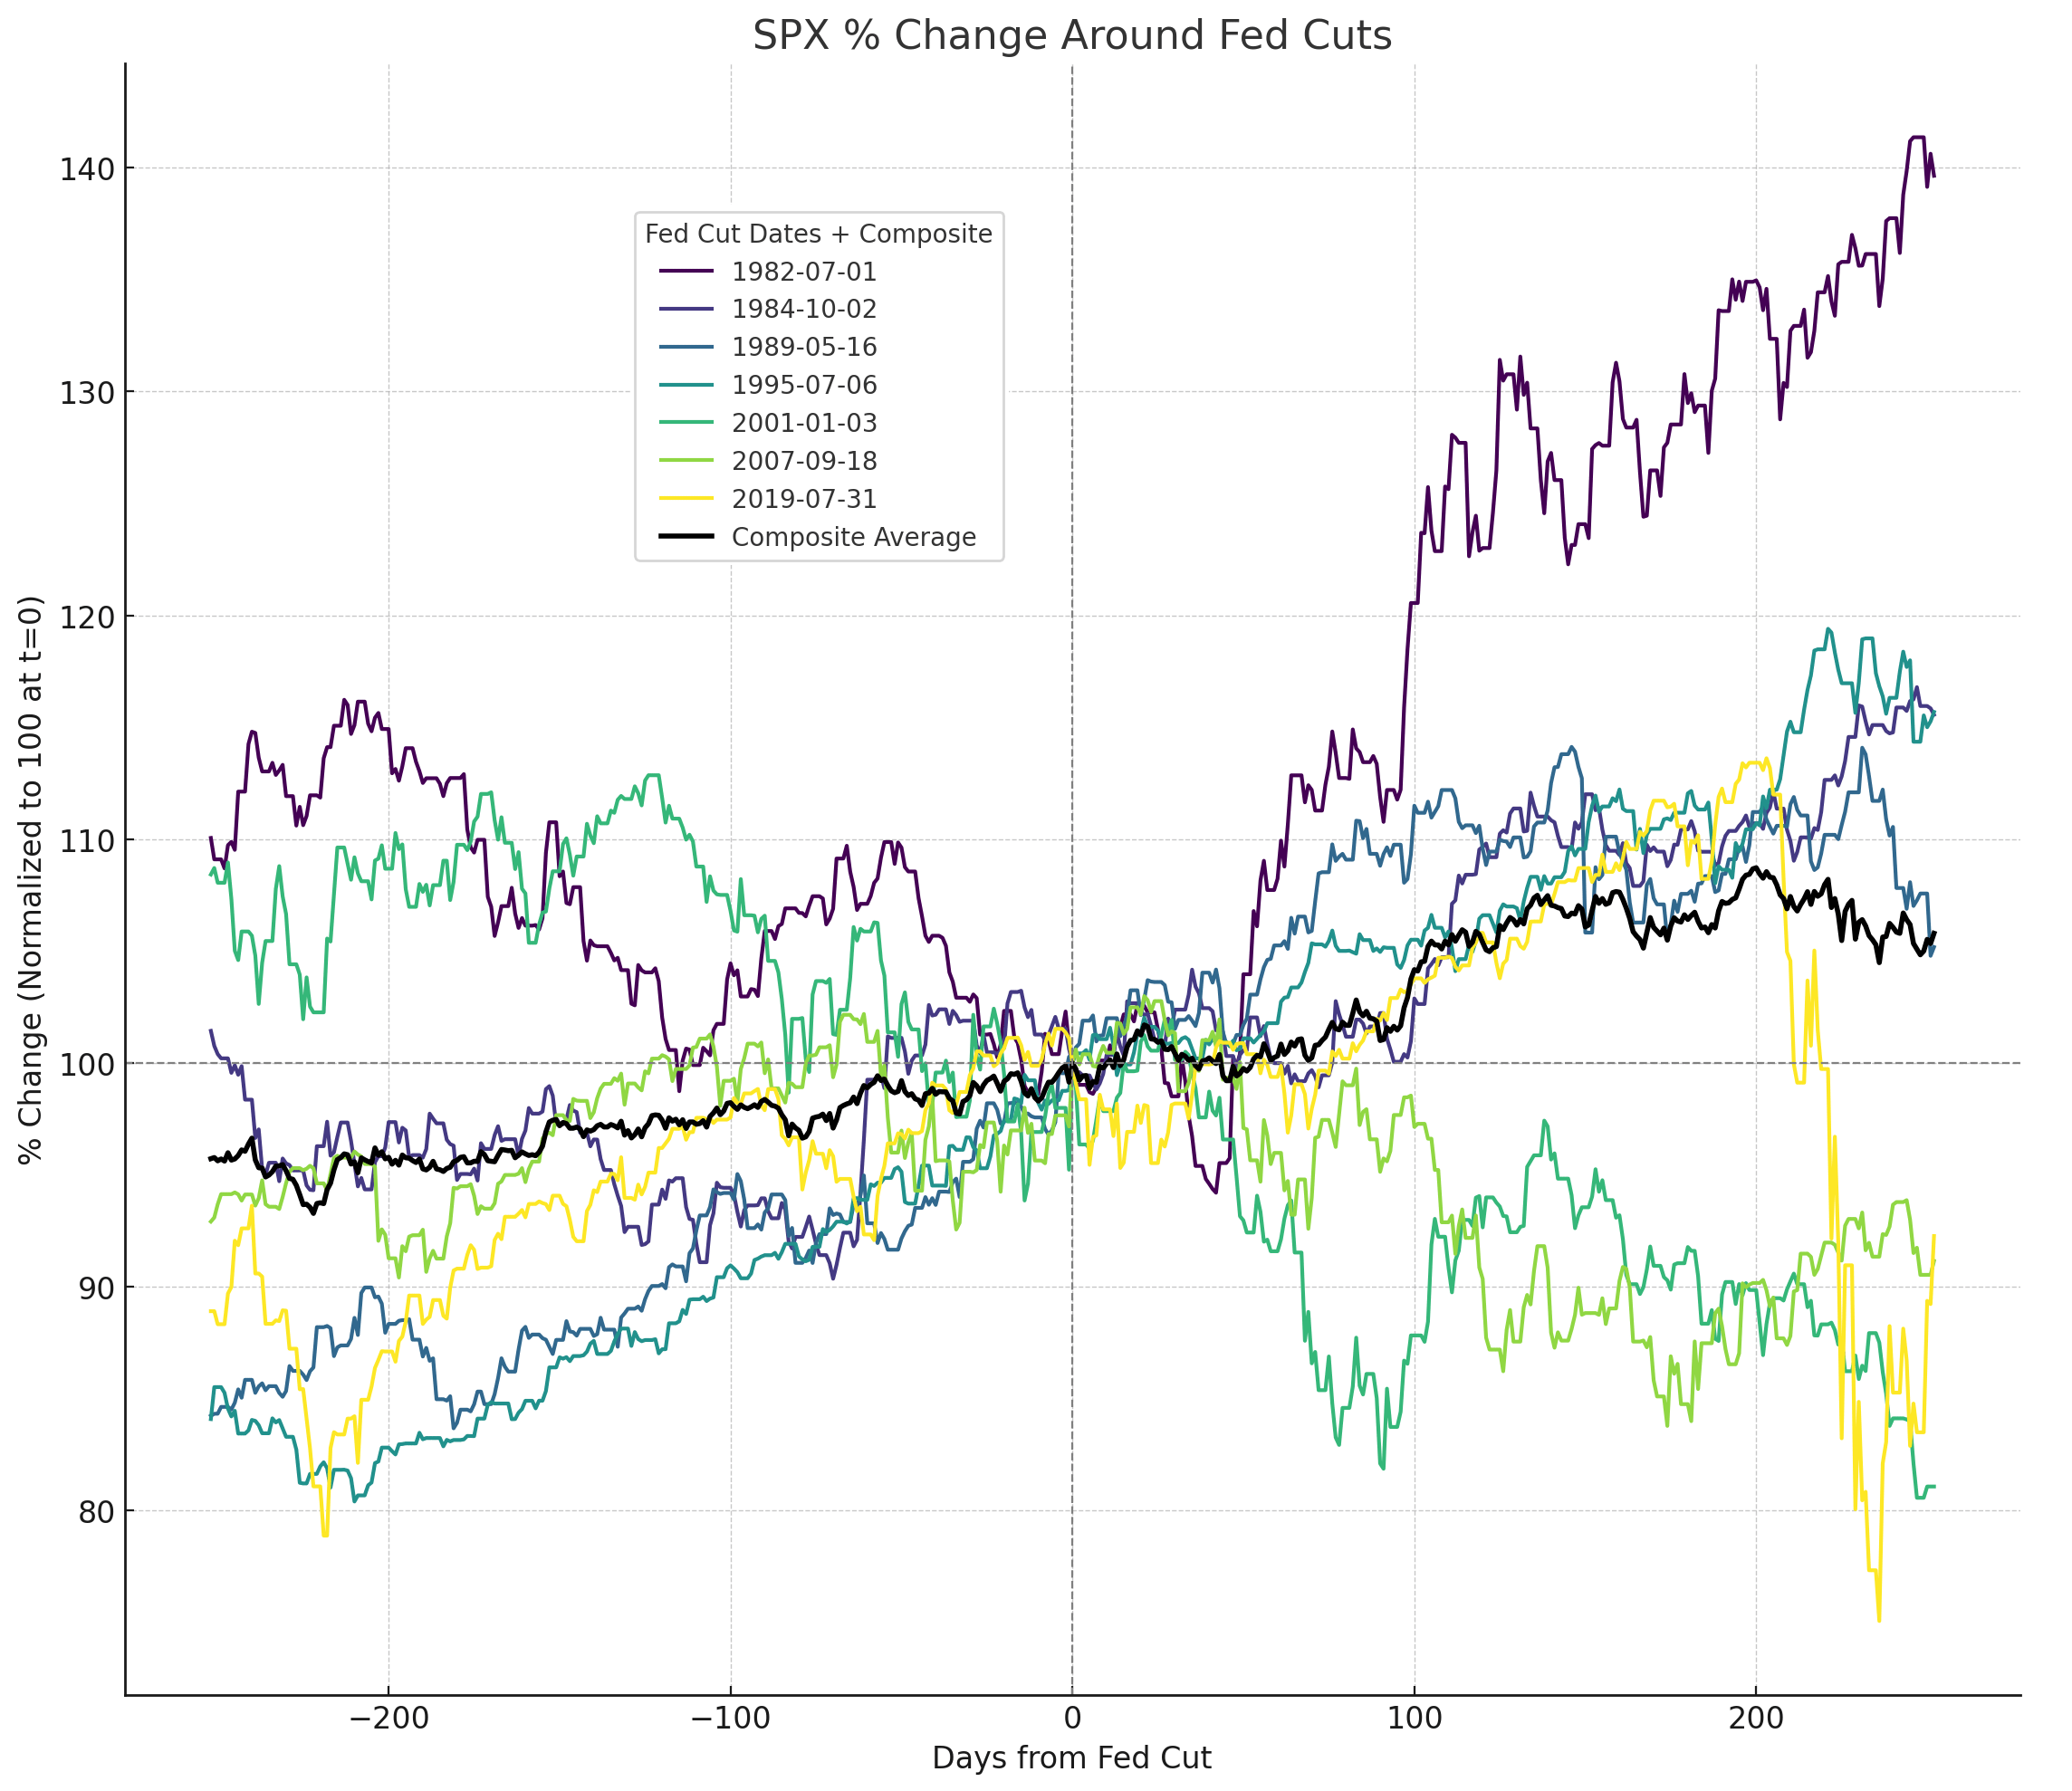
Source: TradingView, StoneX

Impact of Fed Rate Cuts on the Dow Jones Industrial Average (DJIA)
Shifting our focus to “The People’s Index,” the Dow Jones Industrial Average, past Fed rate cuts have similarly seen varied performance:
- The DJIA has seen generally lower volatility leading into the first Fed rate cut of a new cycle, with returns over the prior year falling in the +15% to -5% range.
- Volatility has been much more pronounced once the Fed starts an easing cycle historically, with SPX returns over the next year ranging from -12% to +40%.
- Overall, the index rose 4/7 times (57%) in the year before and 4/7 times (57%) in the year after the first Fed rate cut of a new cycle. This is slightly below the ~70% long-term odds of the DJIA rising over a year.
- On average, the DJIA has risen 5% in the year before the Fed starts cutting interest rates and risen 4% in the year after, both below the long-term average 1-year, price-only returns of ~7-8%.
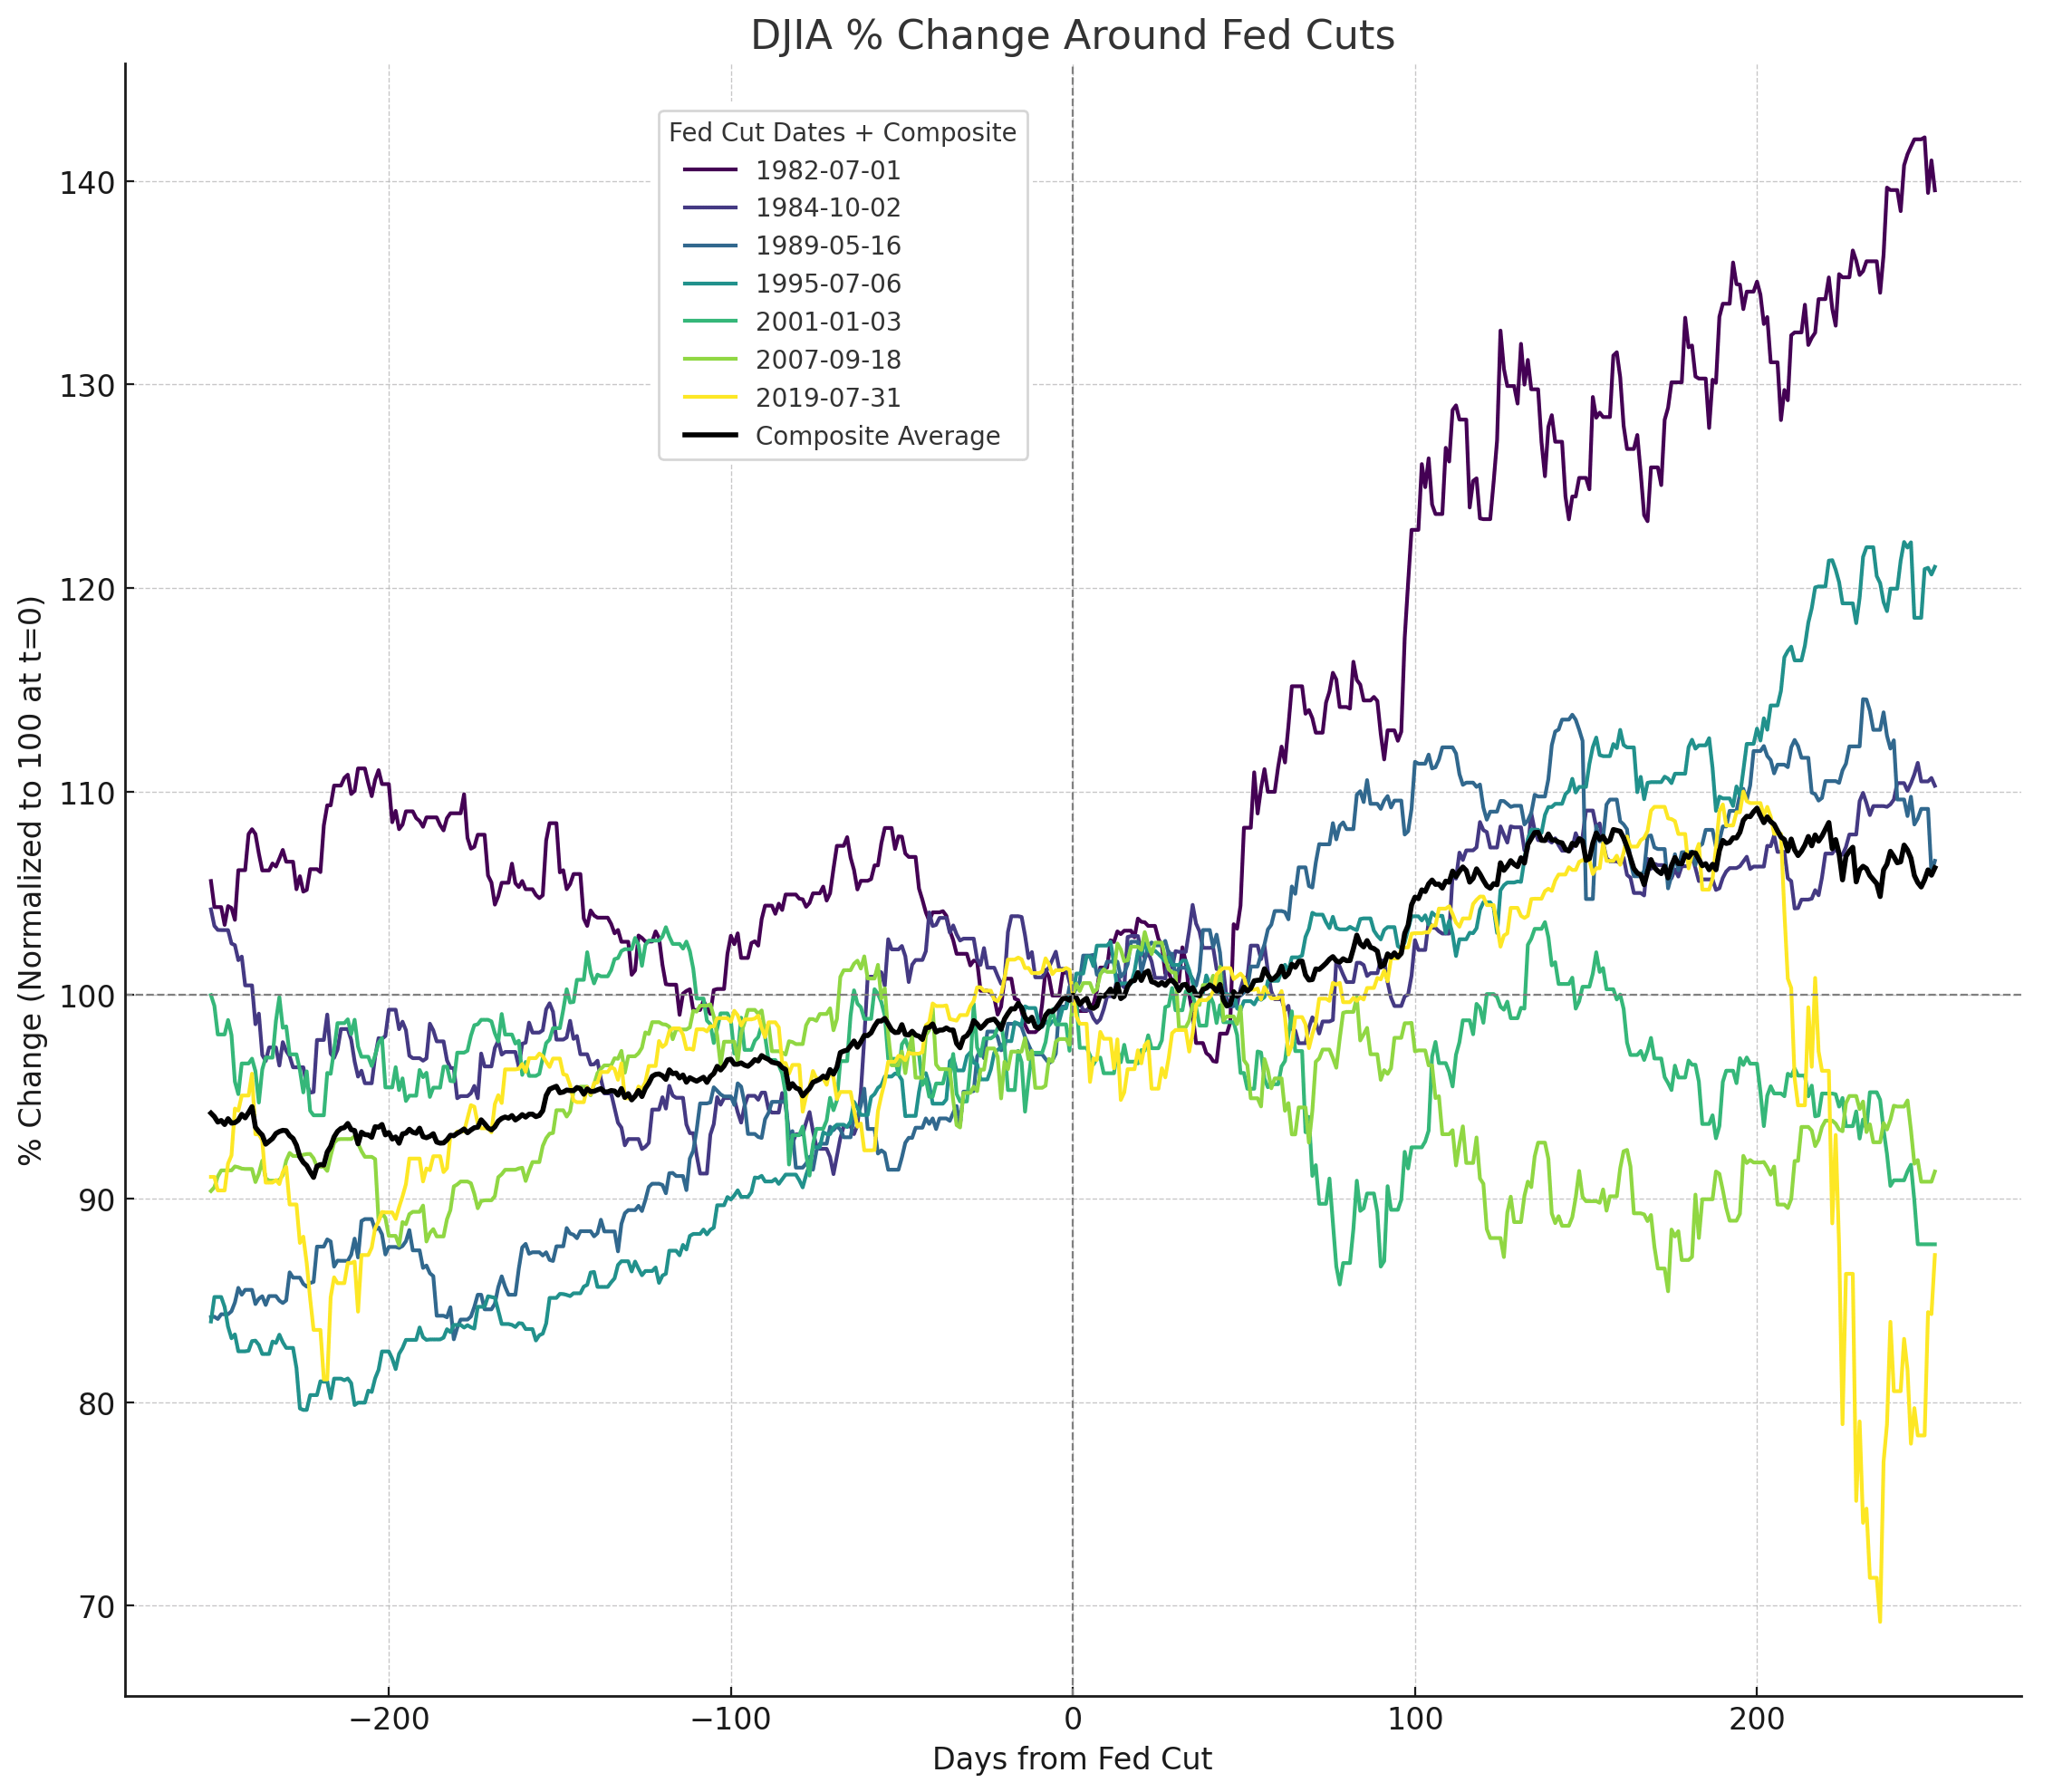
Source: TradingView, StoneX
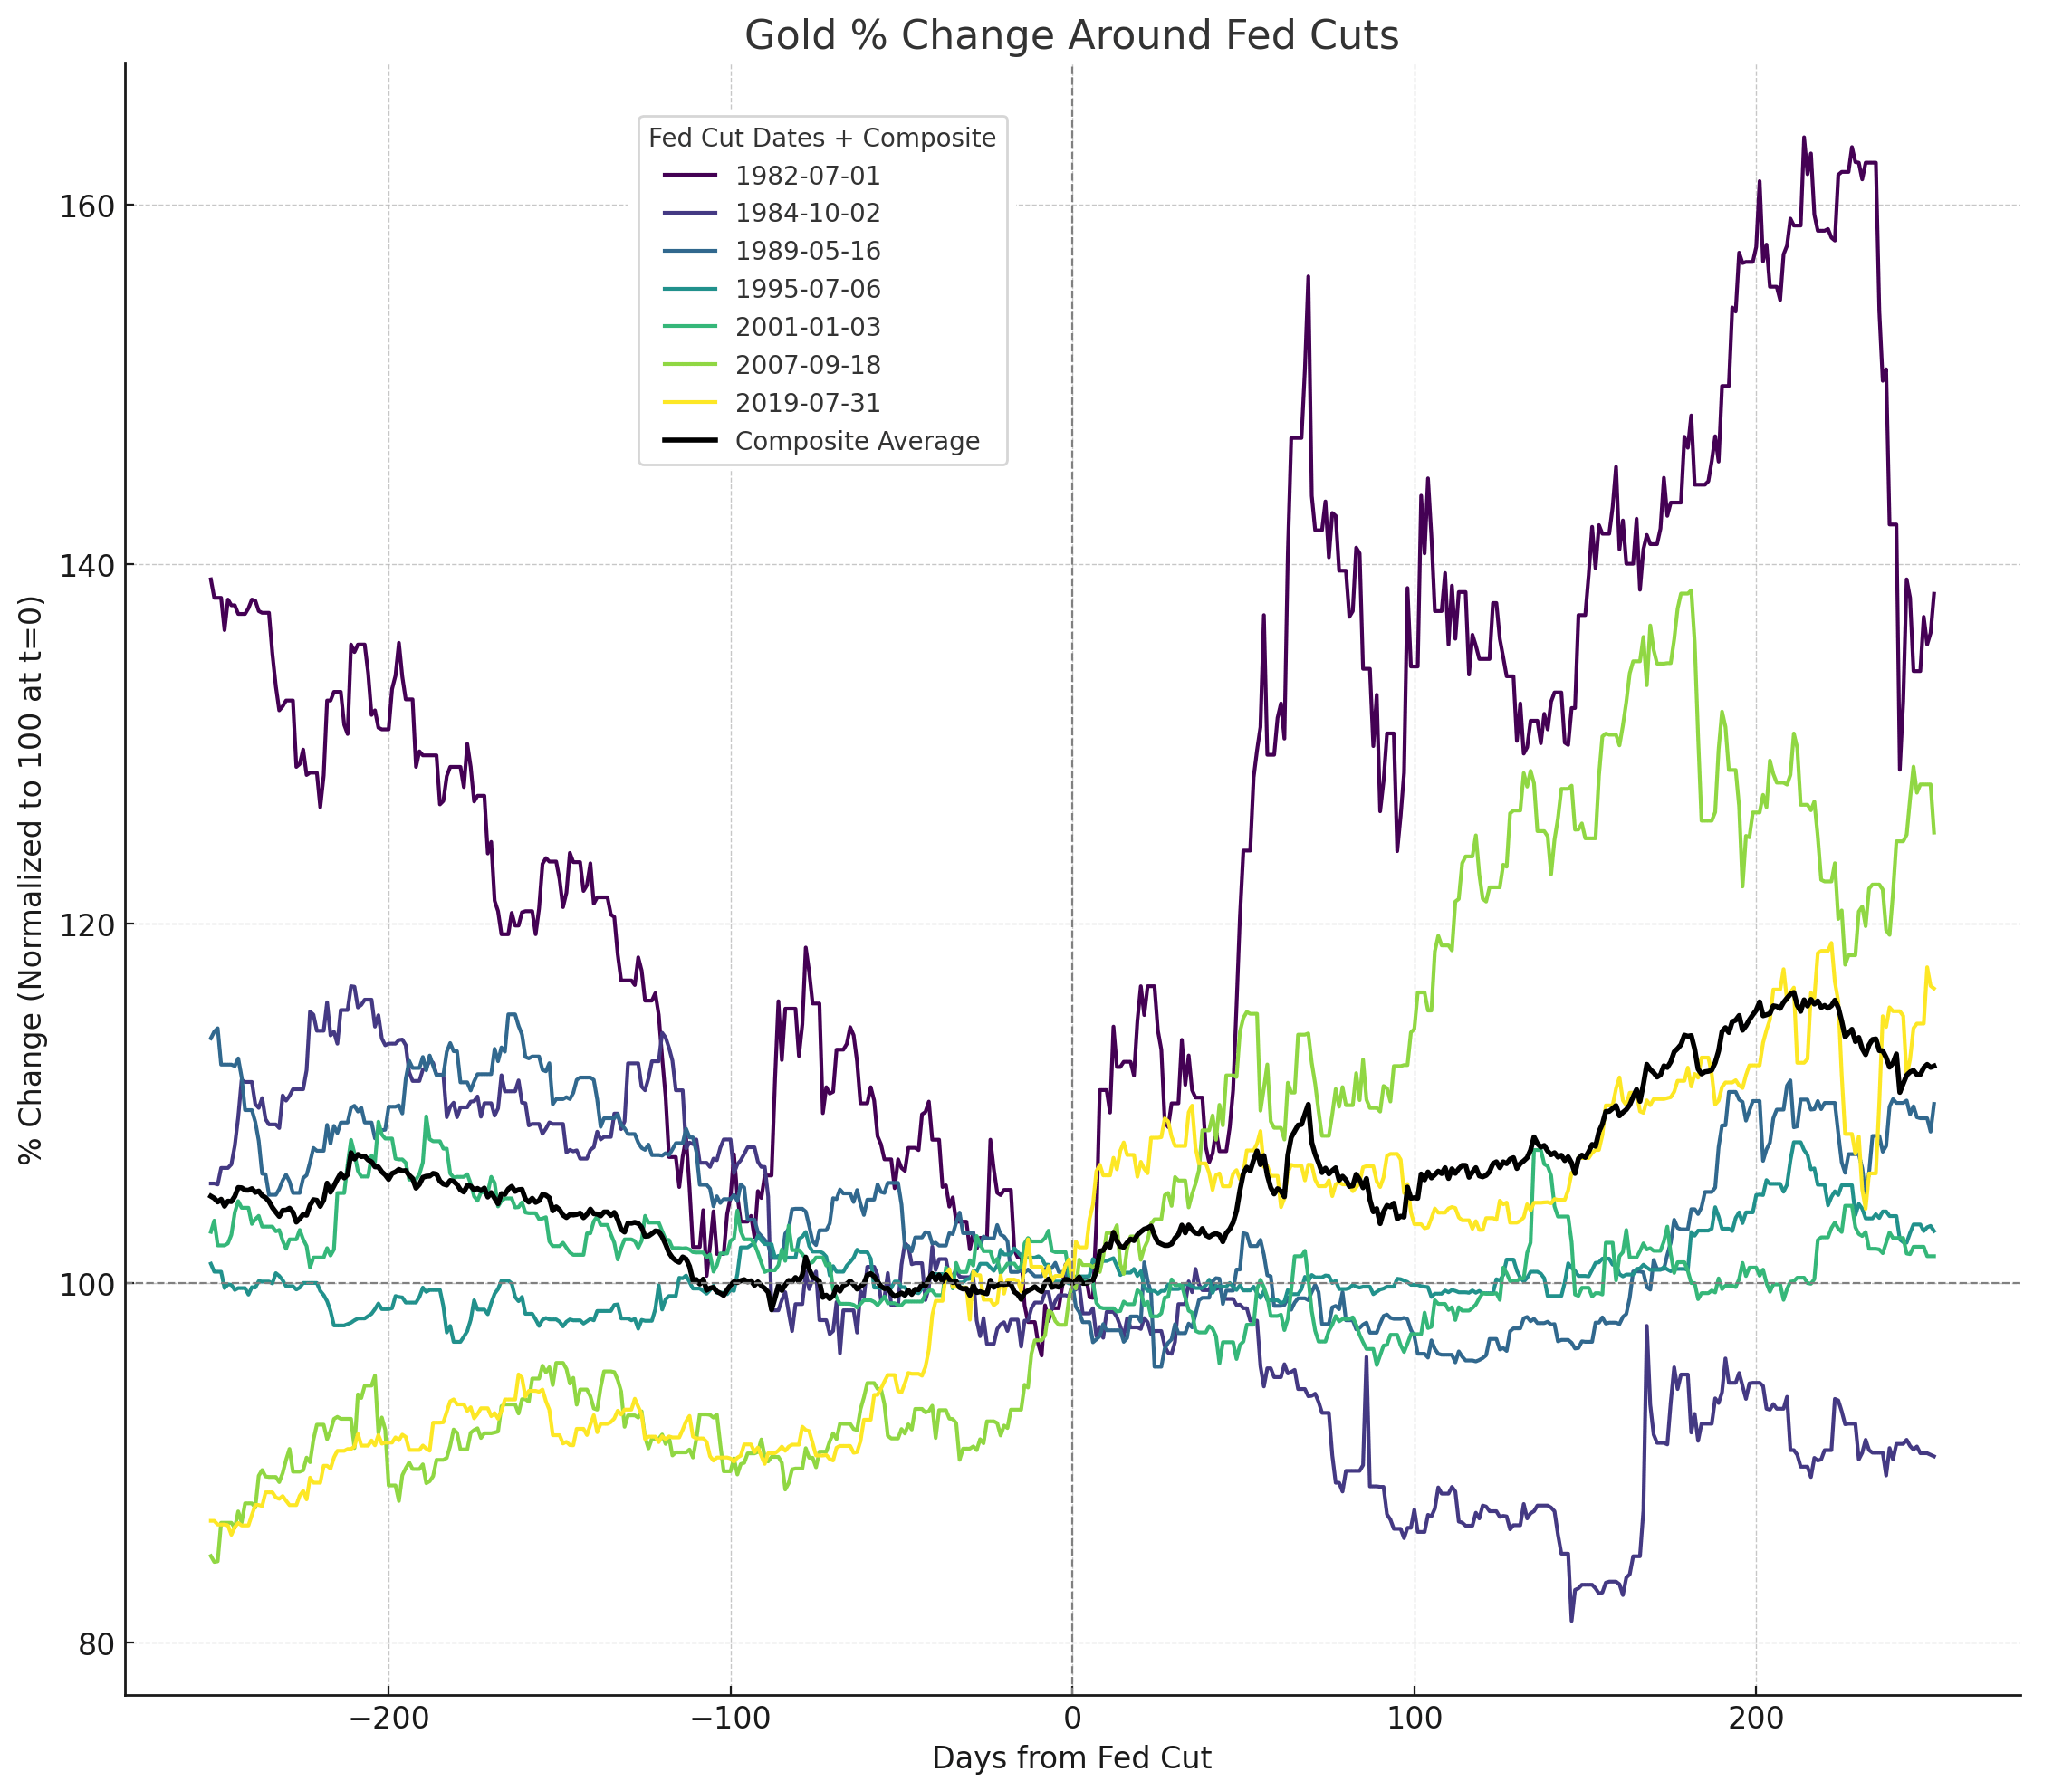
Impact of Fed Rate Cuts on Gold (XAU/USD)
Gold is a particularly interesting asset to analyze in the context of Fed easing, because falling (real) interest rates have historically been a big tailwind for the yellow metal. Looking over the past 40+ years of easing cycles, here are some conclusions that we can draw based on this analysis:
- Gold prices have seen a wide range of 1-year returns heading into a Fed rate cut, spanning from +11% to -39%.
- Post-rate-cut returns have been volatile as well, spanning from -10% to +39%.
- On average, Gold has fallen -4% in the year before the Fed starts cutting rates and risen by 11% in the year after.
- Gold has risen one year after the first Fed rate cut of a new cycle six of the past seven times.
Source: TradingView, StoneX
How do Fed Rate Cuts Impact Indices and Gold?
As we found when it comes to the performance of the US dollar, the start of a new Fed rate cut cycle doesn’t necessarily lead to the “obvious” bullish reaction in US indices that the “don’t fight the Fed” mantra would have you believe. On average, 1-year returns and the likelihood of a gain have both been below average for the S&P 500 and DJIA around Fed rate cuts.
When it comes to gold, the evidence is more clear: Fed rate cuts have generally been a bullish catalyst for gold prices, with average 1-year returns of +11% and 6/7 positive returns in the sample studied.
Time will tell if future cycles follow the historical tendencies, but by better understanding the range of potential outcomes, readers can plan their outlooks for the coming year+ with more confidence.
-- Written by Matt Weller, Global Head of Research
Follow Matt on Twitter: @MWellerFX
Latest market news
Yesterday 01:32 PM
Yesterday 09:35 AM
Yesterday 07:23 AM
Yesterday 04:48 AM
Yesterday 12:17 AM
July 25, 2024 10:39 PM
Latest Fed articles

July 25, 2024 11:02 AM

July 17, 2024 09:15 AM

July 15, 2024 04:21 PM
July 15, 2024 11:21 AM