


Technical analysis is a method of studying market movements. You can think of it as a toolbox for building your trading strategy. In this guide, we’ll take a look at what technical analysis of financial markets is, whether it works and how to do it.
- What is technical analysis?
- How does technical analysis work?
- Technical analysis tools
- Fundamental analysis vs technical analysis
- Does technical analysis work?
- How to use technical analysis in trading
- Which markets can you use technical analysis on?
What is technical analysis?
Technical analysis is the use of charts and statistics to analyse the direction of financial markets and identify entry and exit points for trades. Traders who use it will look to find opportunities from changes in price, volume, momentum and implied volatility.
You might have heard that markets are random. But when you look at price action over any period of time, you’ll start to notice trends and patterns. Technical analysts believe that looking at these regular historical occurrences can hold the key to future price movements.
Markets repeat themselves – these repetitions might not be identical, but they have the same structure. So, if you see a pattern emerging, the chances are others can too. This is what makes technical analysis almost a self-fulfilling trend.
How does technical analysis work?
Technical analysis works using charts, indicators, drawing tools and more to identify future trends and opportunities. You might’ve heard of some of the more popular ones already, such as triangle patterns, moving averages and Bollinger bands.
Did you know? There are 65+ technical indicators that you can apply to City Index charts. You can even customise each to suit your trading strategy.
However, the most important tool in any technical traders’ kit is the price chart.
Technical analysis charts
Technical analysts believe that everything you need to know to trade a market is contained within its current and past prices.
Typically, they’ll analyse this price action on a market’s candlestick chart, which displays its movements over time. It does this by breaking down the price history into individual sessions and displaying each of these as a candlestick. Each candlestick tells you:
- Where the session began (the opening price)
- Where the session ended (the closing price)
- The highest point reached in the session
- The lowest point reached in the session
- Whether the market ended the session up or down
There are other types of charts which show this information in different ways (or sometimes, only show some of it). But candlesticks are the most popular, as they offer a quick way to see how a market’s performing.
Learn how to read candlestick charts.
Plus, charts are the basis for all the other tools we mentioned above. So, let’s take a closer look at each one in turn.
Technical analysis tools
Drawing tools
Drawing tools do exactly what their name implies – enable you to overlay your own lines and shapes onto a market’s chart. They’re some of the simplest technical tools, but can be incredibly helpful.
Say, for instance, that you notice a broad upward trend in a market you’re watching. To confirm that this uptrend is real, you could draw a line connecting the market’s lows over the period. If the line points upwards, then you’ve confirmed the current conditions.
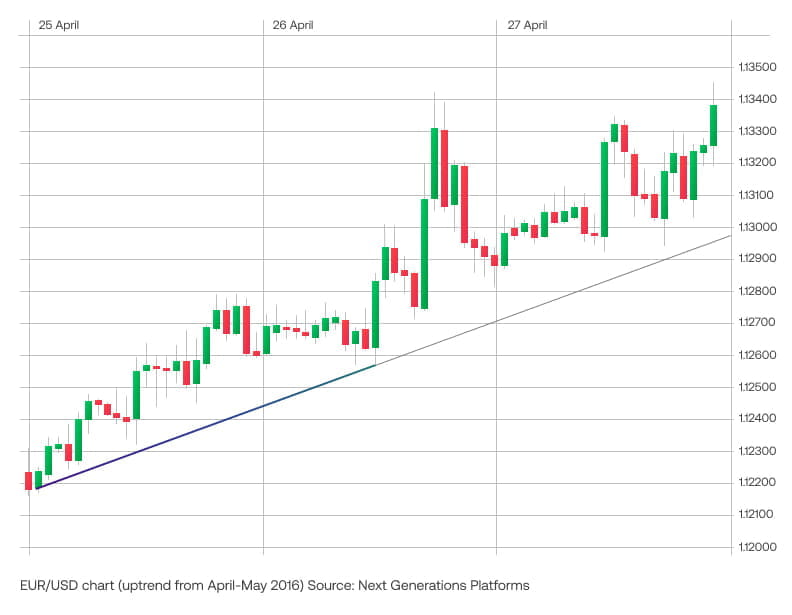
Plus, your line can help predict where the market might head next if the current price action continues. All you need to do is extend it into the future. And to do the same for a market that’s trending downwards, you can draw a line connecting the highs.
You can also use drawing tools to highlight areas of support and resistance. These are pivotal to technical analysis, as they are levels at which the current momentum tends to reverse.
- When a falling market hits a support level, it should bounce back up
- When a rising market hits a resistance level, it should revert back down
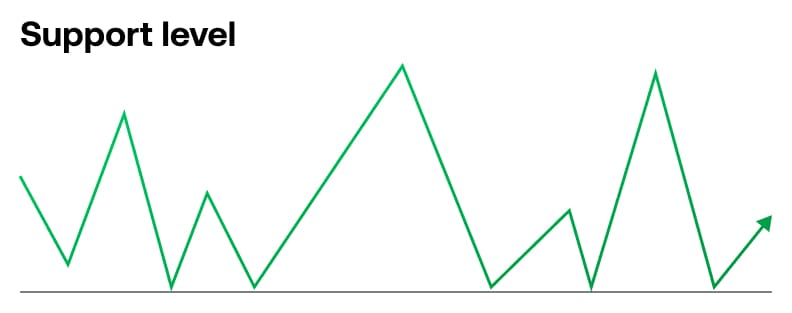
When a support or resistance level is broken, it’s often a strong signal that a new trend is forming.
Since support and resistance can be such powerful signals, it pays to know where they are for your chosen markets. To draw either level on a chart, you need to look for areas that have seen your market reverse multiple times in the past – the more the better.
Then, you can use a horizontal line to outline the area for future use.
Candlestick patterns
Candlestick patterns are motifs made up of one or more candlesticks on a chart, that technical traders believe can offer a signal of future price movement. Remember earlier when we said that historical occurrences can hold the key to future price movements? Well candlestick patterns are the clearest example of that.
For example, the morning star pattern consists of three candlesticks:
- A long red one at the beginning
- A short one with long wicks, indicating a lot of volatility within the session (but that the open and close were almost the same) in the middle
- A long green candle to complete the pattern
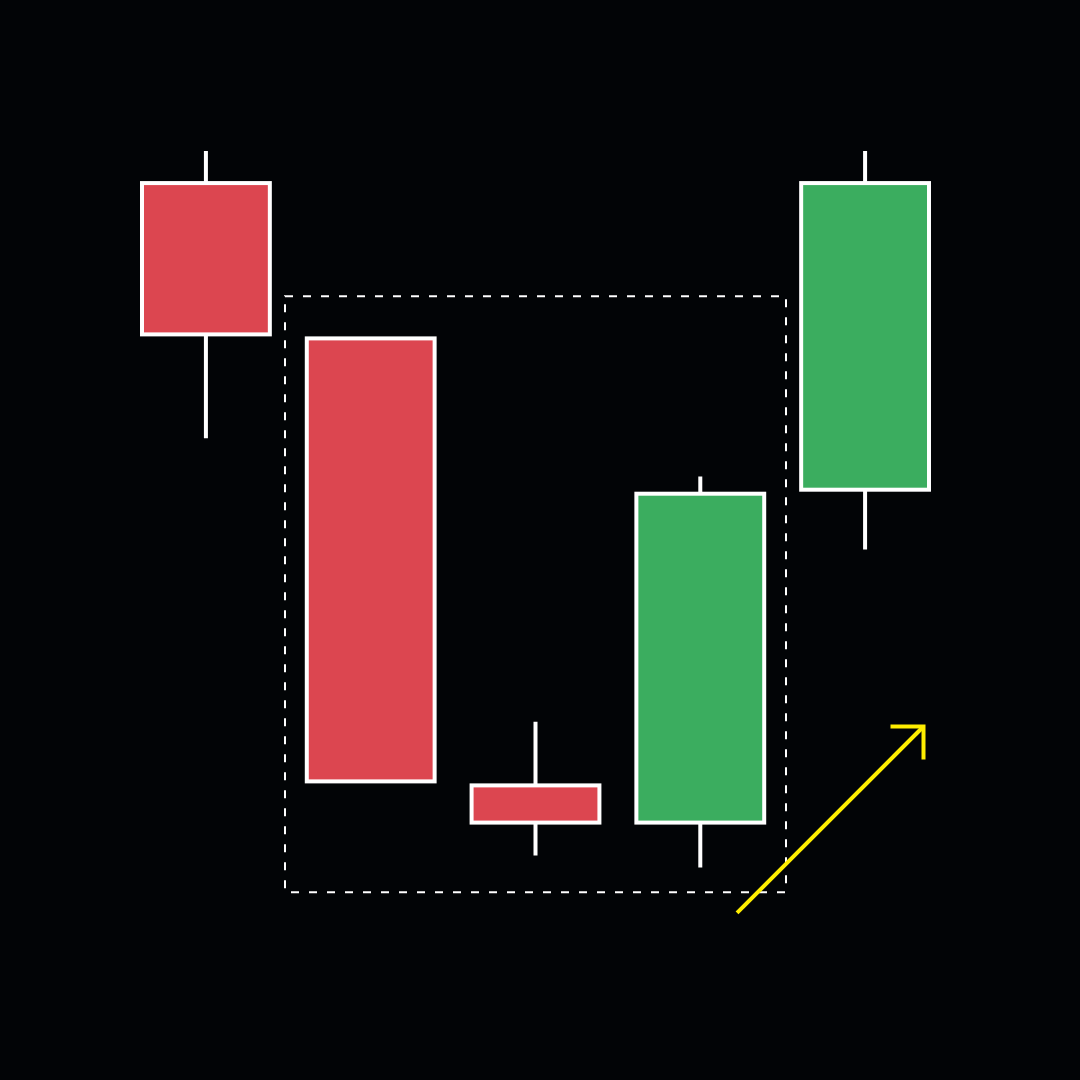
In the past, this formation has typically led to a bullish reversal. So, technical traders watch out for it as a useful signal that an ongoing bear trend might be about to reverse into a bull run.
Not all candlestick patterns are made up of three sessions. The doji, for instance, comprises of a single stick, which has little to no body – meaning that the open and close prices are near identical. Doji tend to indicate indecision in a market, which may mean a reversal is on the cards.
If our morning star pattern above has a doji as the middle candlestick, it makes for a stronger signal.
Chart patterns
Chart patterns are a bit like candlestick patterns, except on a larger scale. Instead of being made up of one of more candlesticks, they tend to take place over lots of sessions. The theory is the same, though – if the pattern has previously led to similar price action in the past, it’s possible that it may do so again in the future.
One well known chart pattern is the descending triangle, which is formed when a market is hitting ever-lower highs, while its lows remain consistent. This gives you a downward sloping resistance line, heading towards a flat horizontal support line – forming a triangle on a market’s chart.
The descending triangle marks a period of consolidation, usually forming after a downtrend. Then, if the market breaks out beyond the support line, the original move should resume, making this a continuation pattern.
Discover the 11 chart patterns you should know when trading.
Indicators
The final type of technical tool we’re going to cover is also the most varied: the indicator.
Most technical indicators use calculations derived from a market’s price to give you a deeper insight into trends and momentum. They come in two main types.
- Overlays appear directly on a chart, on top of the price action
- Oscillators appear in an additional box below a chart
Moving averages (MAs) are one of the most used overlay technical indicators. They calculate a market’s average price over a set number of sessions, and plot that on a line which updates as the price does. Not only does this provide a useful way to see through short-term noise and view major trends, but it can provide some buy and sell signals too.
The relative strength index (RSI), meanwhile, is a popular oscillator. The calculation here is a little more complex, comparing the amount a market moved up in sessions where it gained against the amount it moved down in sessions where it lost. But the end result is a figure between 0-100 that traders use to spot if a market is overbought or oversold:
- A figure above 70 is seen as overbought, a sign that bearish conditions may be on the way
- A figure below 30 is seen as oversold, meaning a bullish reversal could be imminent
Fundamental analysis vs technical analysis
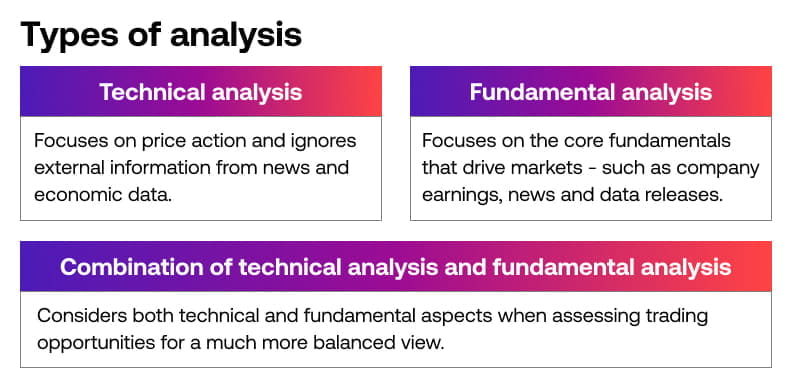
While technical analysis purely looks at prices and patterns, fundamental analysis involves any research into an asset’s ‘real price’. This can include monitoring events, financial statements and macroeconomic data.
The advantages of technical analysis are that you can look at pretty much any trading instrument regardless of whether you have a short-term or long-term timeframe in mind. In fact, technical analysis can be applied to price movements that last just minutes.
You can choose to focus solely on fundamental or technical analysis, but most traders will combine the two for a more well-rounded view of the markets. Want to learn more about fundamental analysis? Take a look at our course.
Does technical analysis work?
Technical analysis works depending on what you’re expecting from it. If you’re hoping it’ll lay out a complete step-by-step of what to trade and when, you could be sorely disappointed.
It reveals just one part of the bigger picture of what’s going on with a market’s price.
In fact, charts are nothing more than a depiction of market sentiment. They show us the mood of investors and speculators, whether they’re optimistic or pessimistic about the price. But they don’t show us the context in which that sits. That’s why technical analysis is commonly referred to as the study of behavioural finance.
For the most part, fundamental analysis helps to guide what you should buy and sell, whereas technical analysis gives you an idea of when to buy and sell it.
Most trading strategies will use technical analysis methods to create a set of clear rules and guidelines to assist in the decision-making process of when, where and how to enter and exit a trade.
How accurate is technical analysis?
The accuracy of technical analysis varies from trader to trader. To work out how accurate your technical analysis is, you can ‘backtest’ your strategy using historical data. You can compare how you thought the market would respond to what actually happened.
How to use technical analysis in trading
To start using technical analysis, follow these 7 steps.
- Open a trading account. Opening a City Index account takes minutes, and gives you access to 1,000s of financial markets
- Add some funds. If you’re trading live markets, then you’ll need capital to open your positions
- Choose which markets to trade. It’s best to start out with markets your familiar with. Popular options include EUR/USD, gold and the S&P 500 (US SP 500)
- Open your market’s chart. You can choose which timeframe to trade on – short term traders tend to take a micro view, while longer-term ones look at the bigger picture
- Identify the current market conditions. Is your market moving upwards or downwards overall, or is it stuck between support and resistance?
- Use patterns and indicators to try and determine where your market might head next. Most technical traders build a strategy using multiple patterns or indicators, or a mix of both
- Open your position. Don’t forget to add stops and limits to manage your trading risk
Just getting started? We’d recommend opening a free trading demo to try out all the aspects of technical trading before you move onto live markets. A City Index demo comes with £10,000 virtual funds to trade our full range of markets, so you can see which chart types, indicators and instruments work best for you.
Which markets can you use technical analysis on?
One of the key benefits of technical analysis is that you can use it on any market – as long as it has a price history, it’ll have a chart. However, there are some asset classes that fit technical analysis particularly well.
Forex
Short-term traders such as scalpers and day traders tend to rely heavily on technical analysis, as they don’t have the time for taking a rigorous fundamental approach. The high volatility and liquidity of forex is a perfect pairing for this style of trading, as there’s always an opportunity to trade.
Forex charts provide a wealth of information, and thanks to the market being open 24 hours a day you can see a continuous run of price action too.
Popular markets: EUR/USD, USD/JPY, GBP/USD
Indices
While they may employ technicals to refine their entry points, stock investors tend to focus more on fundamentals. Indices traders, though, are often far happier using technical analysis. Again, as indices are driven by the movements of 100s of stocks, there always tends to be volatility to power patterns and indicators.
Popular markets: DAX (Germany 40), Dow Jones (Wall Street), FTSE 100 (UK 100)
Commodities
Commodities are also popular among technical traders: particularly oil and gold. Many commodities traders will employ a mix of fundamental and technical analysis, deciding on the overall direction of a market by assessing its fundamentals then turning to its chart for a micro view.
Popular markets: WTI (US Crude), Brent Crude (UK Crude), Gold
Latest market news
Yesterday 01:32 PM
Yesterday 09:35 AM
Yesterday 07:23 AM
Yesterday 04:48 AM
Yesterday 12:17 AM
July 25, 2024 10:39 PM
Latest Technical Analysis articles

July 25, 2024 03:59 PM

July 24, 2024 07:26 PM

July 24, 2024 09:55 AM

July 23, 2024 11:58 AM