


The triangle pattern is a chart formation that signals the continuation of an existing trend, offering technical traders precious insight into where a market might be headed next. Read our guide to ascending, descending and symmetrical triangle pattern trading.
What are triangle patterns?
Triangle patterns are a series of trading formations that give insight into different future price action. There are three types of triangle pattern you can find on financial markets: ascending, descending and symmetrical.
- Ascending triangle patterns form on uptrends, signalling a bullish continuation
- Descending triangle patterns form on downtrends, signalling a bearish continuation
- Symmetrical triangles can form in any conditions, and signal a move in the direction of the breakout
Let’s take a closer look at each type. Or for more chart formations, take a look at our chart patterns guide.
What is the ascending triangle pattern?
The ascending triangle pattern is a bullish chart formation that forms after an uptrend. In an ascending triangle, the bull run stalls – but as a continuation pattern, it signals that the good times will resume once the resistance line is broken.
To spot an ascending triangle, look for a market that was trending upwards but is now bouncing off a horizontal resistance level. Its lows, however, should be steadily rising each time, giving an upward-sloping support line.
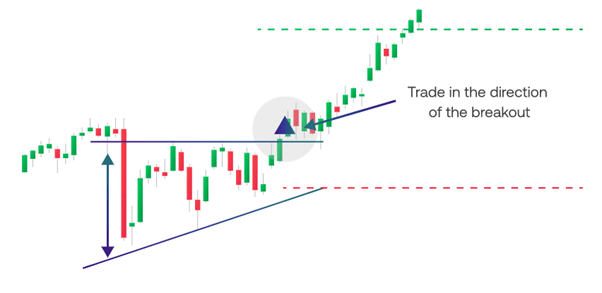
This consolidation period can’t last forever, and at some point, the market will have to break out beyond either line. If it breaks out upwards, the pattern has completed and the uptrend should resume. If it breaks out below support, the pattern has failed and the market may be in for a reversal.
Learn more about candlestick patterns.
What is the descending triangle pattern?
The descending triangle continuation pattern is the opposite of an ascending one. After a downtrend, a market consolidates. But it continually tests the same support horizontal line, while its highs get lower and lower. If the support line is broken, the downtrend continues.
Descending triangles are the upside-down equivalent of ascending triangles. The support line is flat, but the resistance line is line sloping downwards, indicating that while bears are unable to push the market any lower, they are still in control against the bulls.

A descending triangle pattern completes if the market breaks out below the support line – which should signal the beginning of a renewed bear run. If the market breaks upwards instead, the pattern has failed.
Learn more about how to read charts.
What is the symmetrical triangle pattern?
The symmetrical triangle pattern is a formation that looks a little bit different to other triangles, and can also signify different price action. When you spot a symmetrical triangle, it can signal either a continuation or a reversal – it all depends on which way the breakout lands.
As you may have guessed from the name, this pattern resembles a symmetrical triangle. That means there’s no horizontal support or resistance line. Instead, both point toward each other. It looks a bit like you’ve overlayed an ascending triangle onto a descending one.
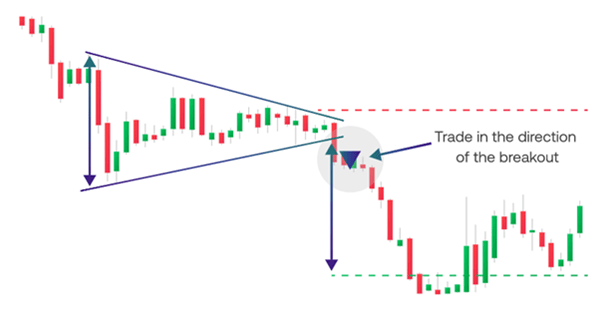
Symmetrical triangle patterns can appear in both uptrends and downtrends.
- In an uptrend, a breakout through resistance signals a continuation, while a breakout through support signals a reversal
- In a downtrend, the opposite is true. If resistance is broken, the bear market may continue. If support is broken, a reversal may be on the cards
How to trade triangle patterns
To trade the triangle pattern, you’d typically look to open a position that earns a profit from the subsequent trend.
- In an ascending triangle, you’d open a buy position once the market breaks through its resistance line
- In a descending triangle, you’d open a sell position once the market breaks below its support line
However, as with any pattern, leaping straight into a position the moment you see a completed triangle is rarely advised. Instead, most traders wait for confirmation before placing an order.
The simplest confirmation when triangle pattern trading is to wait for the end of the next candlestick. If it closes in the right direction, then you have your confirmation. If it doesn’t, then the pattern may have failed. However, you can also use indicators as part of a triangle trading strategy.
Trading the symmetrical triangle chart pattern
To trade a symmetrical triangle pattern, you’d look to open a position that profits from the resulting trend. However, unlike other triangle patterns, here we don’t necessarily know the direction of the potential price action.
You can look at the market’s movements within the triangle itself for a clue. If the market continually tests its support level, for example, then it may be a signal that a breakout downwards is more likely. Alternatively, we could turn to a technical indicator to see whether bulls or bears have the upper hand.
You don’t necessarily have to pick a side, though. Some traders use a combination of buy and sell entry orders to automatically open a position when the market breaks out in either direction. If the market breaks out upwards, your buy order would trigger. A move down would see your sell order executed.
If you’re using this strategy, make sure to place your entry orders far enough above or below the triangle’s edges to enable you to confirm the pattern – and that each entry order has a stop and a limit attached.
Setting your stop loss for a triangle
Waiting for confirmation should help reduce the likelihood of failed triangle trades, but it isn’t a foolproof method – so you’ll still want to ensure you have a stop in place.
Where you place your stop depends on which type of triangle you’re trading.
- For ascending triangles, you’d look to place your stop just below a recent significant low
- For descending triangles, it’d be above a recent significant high
- For symmetrical triangles, it depends on the direction of the breakout
Setting a limit is also generally advised, to automatically close your trade if it hits your profit target. Many technical traders set their profit target using the width of the triangle at its widest point, which may signal the length of the resulting trend.
Using the width of the triangle and the market’s recent low, you can calculate your risk-reward ratio for the trade. For example, if an ascending triangle is 200 points wide and the market bounced off support 100 points ago, your risk-reward ratio is 1:2.
Start triangle pattern trading
Follow these steps to start trading triangles with City Index today:
- Open your City Index account, or log in if you already have one
- Add some funds
- Look for triangle patterns using our advanced technical analysis tools
- Open your buy or sell position
Alternatively, you can practise trading triangles with a cost-free City Index demo account. You’ll get full access to our platform, preloaded with virtual funds. So, you can test out your triangle trading strategy with zero risk.
Latest market news
Yesterday 01:32 PM
Yesterday 09:35 AM
Yesterday 07:23 AM
Yesterday 04:48 AM
Yesterday 12:17 AM
July 25, 2024 10:39 PM
Latest Financial market insight articles

June 17, 2024 01:00 AM


March 26, 2024 04:11 AM

October 25, 2023 01:45 PM