


Fibonacci retracements can offer invaluable insight into future areas of support and resistance. Learn all about Fibonacci retracement levels here: including how they work, and how to trade with them.
- What is Fibonacci retracement?
- How do Fibonacci retracements work?
- The Fibonacci retracement levels
- How to use Fibonacci retracement
- Start Fibonacci trading
- Fibonacci retracements summed up
- Fibonacci FAQ
What is Fibonacci retracement?
Fibonacci retracement is a technique used in technical analysis to predict future areas of support or resistance after a significant market move. It involves using a drawing tool that highlights potentially significant price action levels based on Fibonacci theory.
It all boils down to the Fibonacci sequence, a series in which each number is derived by adding the two previous entries together. It starts with zero and one, which you add together to get one. Then one plus one is two, two plus one is three, three plus two is five and so on.
This gives you a sequence that looks like this:
0, 1, 1, 2, 3, 5, 8, 13, 21, 34, 55, 89, 144, 233, 377, 610, 987, 1597 … all the way ad infinitum.
The sequence is named after Leonardo Bonacci, although he didn’t discover it – just made it known to the Western world, after Indian mathematician Acarya Virahanka and a series of Indian mathematicians invented then developed the theory.
For traders, however, the key aspect of Fibonacci theory lies in the ratios derived from the figures within the sequence. Dividing each number in the sequence by the one that follows it, for instance, always returns a ratio of 0.618 when the numbers in the sequence are high enough. Switch it around and divide by the preceding number, and you get 1.618, also known as the golden ratio.
These ratios crop up across mathematics, and Fibonacci traders use them to predict potential upcoming reversals and breakouts too – by using Fibonacci retracements.
How do Fibonacci retracements work?
Fibonacci retracements work by enabling you to draw a trend line between the beginning and end of a significant market move. The drawing tool then plots lines at percentage levels calculated based on Fibonacci ratios.
These lines are seen as potential areas of future support or resistance, indicating when the retracement of your original move might end.
Fibonacci retracements can also be used to add extra weight to certain chart patterns, or even in Elliott wave theory.
Unlike most technical indicators, there’s no formula involved here. The tool simply takes the entirety of the trendline you’ve drawn and calculates retracement levels using the percentage forms of the Fibonacci ratios.
Say, for example, that gold rallies from $1,800 to $1,900 before reversing. Using our first ratio above, we might predict that the following retracement will end at 61.8% of the original move – or in other words, that gold could fall 61.8 points to $1,838.2 before resuming its rally.
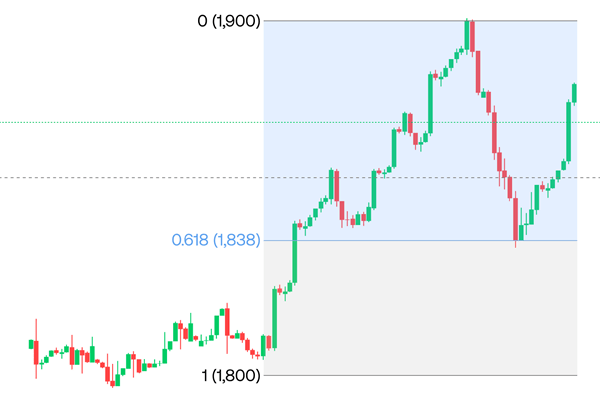
By using the Fibonacci retracement tool on a chart to draw a trendline over the move from $1,800 to $1,900, you’ll see the $1,838.2 support line highlighted automatically: alongside all the other Fibonacci retracement levels.
The Fibonacci retracement levels
There are numerous Fibonacci retracement levels, all calculated using different functions between the numbers in the Fibonacci sequence. We’ve already covered 61.8% and 161.8%, but other key examples include:
- 23.6%, calculated by dividing a figure by the third following figure (for example, 13 / 55)
- 38.2%, calculated by dividing a figure by the second following figure (for example, 13 / 34)
- 78.6%, calculated as the square root of 0.618
- 261.8%, calculated by dividing a figure by the second preceding figure (for example, 89 / 34)
- 423.6%, calculated by dividing a figure by the third preceding figure (for example, 233 / 55)
Those are the main Fib levels, although there’s one other that’s usually included despite having nothing to do with Fibonacci: 50%.
Fibonacci retracements vs extensions
You may have noticed that not all of our retracement levels are below 100%: 161.8%, 261.38% and 423.6% are all above it. There are other notable examples too, including, 118%, 138% and 150%. These are the Fibonacci extension levels, and you can use them to predict where a market might run to after a breakout.
Say, for example, that gold doesn’t reverse at $1,900. Instead, it breaks through a key area of resistance and carries on the rally. We can use the Fibonacci tool to plot when the trend might end: with new potential resistance levels at $1,918, $1,938, $1,950, $1,961.8 and so on.
With City Index’s TradingView charts, you can plot Fibonacci extensions automatically with the Trend-Based Fib Extension tool. Open your trading demo account to see how it works.
How to use Fibonacci retracement
To use Fibonacci retracement in your trading, you plot where potential support or resistance levels could land based on a recent significant move and plan your approach accordingly. What that entails specifically depends on your chosen strategy and style.
Swing traders, for example, might look to enter a market just after an initial reversal, and use Fibonacci retracements to calculate possible exit levels. This is useful for risk management, helping you calculate your risk-reward ratio for a trade ahead of time.
Breakout traders, on the other hand, might use Fibonacci extensions to decide when a trend might eventually peter out – again, in order to spot a possible exit or plan risk vs reward.
You can use Fibonacci retracements to dictate when you open positions, too, and capitalise on the new run that forms after a countertrend ends. As with any technical strategy, you’ll want to confirm that your predicted price action is underway before you open your position. For example, you might look for a doji candlestick that falls on a Fib level, an extra hint that a reversal is on the cards.
One reason why Fibonacci retracements are so popular is that they’re future-facing, unlike many other tools for plotting support and resistance which rely on past data. As soon as a move is completed, you can use the tool to plot possible support or resistance levels, without waiting for more data.
How to draw Fibonacci retracement on a chart
To draw Fibonacci retracement on a chart, you can follow these steps:
- Open your trading platform and choose your market
- Select the Fibonacci retracement drawing tool
- Draw a trend line between the beginning and end of your market’s last major move
You should also be able to tweak the parameters of the tool – for instance, selecting which levels appear.
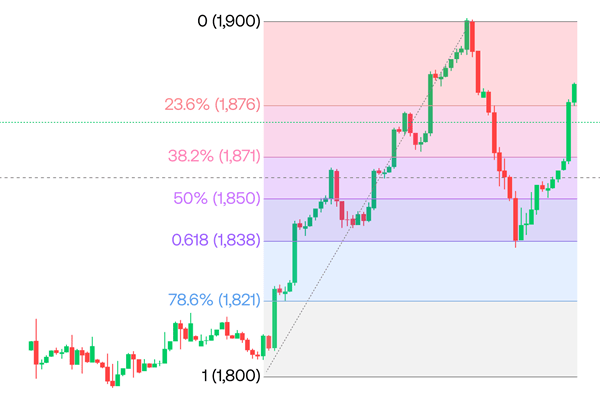
Of course, how these levels apply to your chart will depend on whether you’re plotting retracements on an upward or downward move. You’ll always want the zero point on your drawing to be at the beginning of the retracement – so $1,900 on our gold example. The 100% level, on the other hand, is at the beginning of the initial significant move ($1,800 above).
This gives you the following Fib levels:
- 23.6% at $1,876.4
- 38.2% at $1,871.8
- 50% at $1,850
- 61.8% at $1,838.2
- 78.6% at 1,821.4
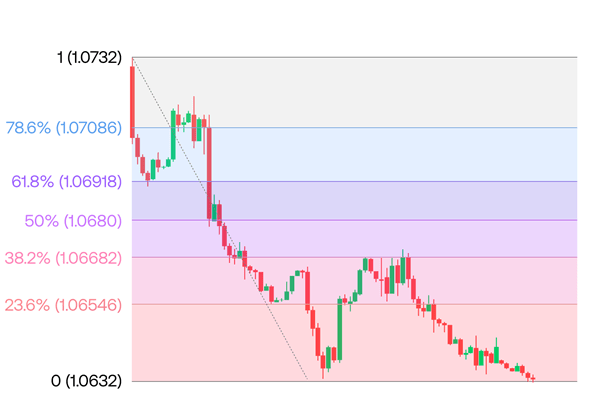
What if we were looking at a retracement after a market falls instead? Say that EUR/USD falls from 1.0730 to 1.0630. Here, our zero point would be at 1.0632 and 100% at 1.0732, giving retracement levels of:
- 23.6% at 1.06546
- 38.2% at 1.06682
- 50% at 1.0680
- 61.8% at 1.06918
- 78.6% at 1.07086
Start trading with Fibonacci retracement levels
With City Index, you can trade with Fibonacci retracement levels across 1,000s of major markets. Follow these steps to get started:
- Open your City Index account and add some funds
- Log in to our award-winning Web Trader platform or download our mobile trading app
- Search for your chosen market, and apply your Fibonacci analysis
- Choose to buy to go long, or sell to go short
Alternatively, you can buy and sell our full selection of stocks, indices, forex, commodities and more with a demo account, which gives you virtual funds to try out trading on live markets with zero risk. This is a great option for beginner Fib traders, as it helps you plan your strategy without putting up any capital.
Fibonacci retracements summed up
- Fibonacci retracements plot potential support and resistance levels on a chart after a market move
- They’re based on the Fibonacci sequence and ratios, introduced to the West by Leonardo Bonacci
- You can use retracements to plot when a countertrend might end, and extensions for a trend after a breakout
- Some of the key levels are 38.2%, 50% and 61.8%
- To plot Fibonacci levels on a chart, you can use the Fibonacci retracement drawing tool
- Traders use Fibonacci retracement levels to plan their entries, exits and risk-reward ratios
- Unlike many other tools for identifying support and resistance levels, Fibonacci retracements aren’t a lagging indicator
- You can access the Fibonacci retracement tool on City Index’s TradingView charts
Fibonacci retracements FAQ
Is Fibonacci a leading indicator?
Fibonacci is considered a leading indicator in trading, because they face forward instead of relying on past data. Leading indicators are rare and are often considered more useful than lagging indicators because they offer insight into upcoming price action.
Learn more about technical indicators in our Trading Academy.
What is the Fibonacci golden ratio?
The Fibonacci golden ratio is 1.618 or its inverse .618. This is often seen as the most important Fibonacci ratio, and has uses across mathematics – not just in trading. The golden ratio has been recorded appearing in everything from classical art to bee populations to plant seed formations.
The golden ratio is actually an irrational number, meaning it has an infinite number of figures after the decimal point. But it is often shortened to 1.618.
What are the disadvantages of Fibonacci trading?
Like any method of technical analysis, Fibonacci trading is by no means foolproof. There’s no guarantee that your market will reverse at a Fibonacci retracement level – and even if it does, you don’t necessarily know which one ahead of time.
Successful technical traders mitigate this with comprehensive, effective risk management, ensuring they always have a plan for if a trade fails.
Latest market news
Yesterday 01:32 PM
Yesterday 09:35 AM
Yesterday 07:23 AM
Yesterday 04:48 AM
Yesterday 12:17 AM
July 25, 2024 10:39 PM
Latest Technical Analysis articles

July 25, 2024 03:59 PM

July 24, 2024 07:26 PM

July 24, 2024 09:55 AM

July 23, 2024 11:58 AM