


A moving average (MA) smooths price movements out into a single trend line. It’s one of the most popular indicators among technical analysts, so let’s look at how to use it.
- What is a moving average?
- Types of moving average
- Simple moving average vs exponential moving average
- How to calculate a simple moving average
- How to use a moving average to predict trends
- Moving average convergence divergence explained
- How to set up a moving average on a trading platform
- Moving averages summed up
- Moving averages FAQs
What is a moving average?
A moving average (MA) is an indicator used to identify price trends. It smooths out the daily fluctuations on a chart that can cause markets to appear random or even noisy, making it easier to understand the main direction of movement.
The main purpose of a moving average is to determine the direction of a trend as early as possible by looking at past prices. But as they’re based on historical data, all moving averages are lagging indicators and are not predictive, like leading indicators are.
Moving averages are useful for traders who are seeking to trade with the trend and keep positions open for an intermediate to a longer-term timeframe.
Types of moving average
There are a lot of types of MAs and traders typically use more than one to determine market momentum. But the main two are:
- Simple moving averages (SMAs)
- Exponential moving averages (EMAs)
Simple moving average vs exponential moving average
A simple moving average is the standard MA, it takes the mean of a given set of values over a specified period, giving each weight an equal value. Meanwhile, an EMA uses a SMA as its base but then gives more weight to the most recent prices.
Like SMAs, a rising EMA indicates that prices are rising, and if the current price is above the EMA line, it’s a buy signal. The opposite is true for a falling EMA.
EMAs generally react more quickly to price changes than other moving averages, which is why they tend to be used over a plain SMA. However, the EMA is also more prone to fluctuations.
Unlike the SMA, which is normally used on its own, the EMA is primarily used as the base of other indicators, such as the moving average convergence divergence (MACD), which we’ll look at later.
How to calculate a moving average
Whether you’re looking to use a simple moving average or an exponential moving average, you must start by calculating the SMA.
To do this, you need to find the sum of a certain number of closing prices over a set period and then divide it by the number in the series. You can choose from several different periods. The most popular are the 5-day, 10-day, 20-day, 50-day, 100-day and 200-day moving averages.
You can also change the timeframe of your MA, depending on whether you want to look at minutes, hours, days or weeks. For short-term traders, the most common timeframe is daily, and for longer-term traders, it’s weekly.
To calculate a simple 5-day moving average of the closing price, the following formula can be used:
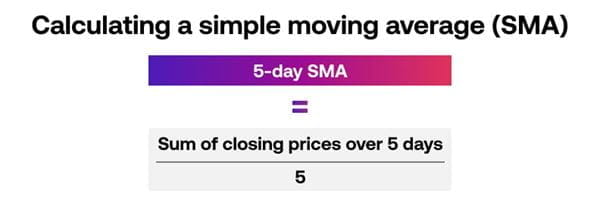
However, the indicator would do these calculations for you automatically and update the data depending on your parameters. So, for the daily average above, the series would update to include the current day's closing price.
For an EMA, you’d then need to find the weighting multiplier and calculate the exponential moving average for each day between the initial EMA value and the present day, using the price, the multiplier, and the previous period's EMA value.

But again, your platform will automatically do all of this for you.
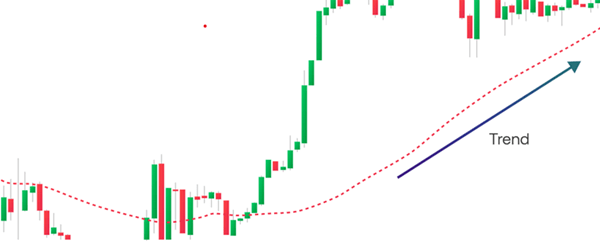
How to use moving averages to predict trends
In general, a market can be considered bullish when trading above its moving average and bearish when trading below the moving average. However, they also generate some useful trading signals:
Buy signals
For a buy signal, the moving average should be rising and pointing upwards. When the market closes above the MA, a buy signal can be implied. You’d exit the market when the market closes below the MA.
Sell signals
For a sell signal, the moving average should be falling and pointing downward. When the market closes below the moving average a sell signal can be considered. You’d exit the market when the market closes above the MA.
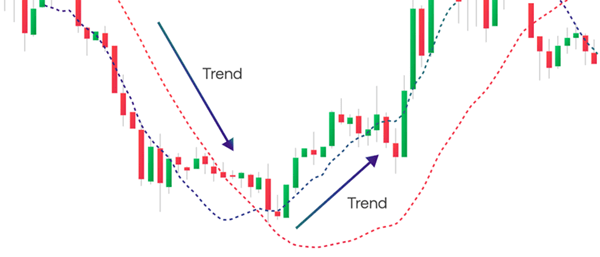
Moving average crossovers
Another popular way of using the moving average indicator is a crossover technique. You’d apply two or more moving averages to your chart that have different data periods. Usually, a trader uses a slower-moving average that has fewer periods and a longer MA that has more periods.
When the slower MA crosses over the faster MA, it’s a signal to enter or exit your trade.
For example, when an SMA with a short-term period, say 15 days, crosses above an SMA with a long-term timeframe, say 50 days, it usually means that the market is in an uptrend.
When an SMA with a shorter period crosses below an SMA with a longer period, it usually means that the market is in a downtrend.
Traders can also use SMAs to detect areas of support when a trend changes direction. Generally, an SMA with a longer period can identify a stronger level of support.
To get started using moving averages, why not open a demo account and practise first in a risk-free environment? Or, if you feel confident enough to enter live markets, open a full account today.
Moving average convergence divergence (MACD) explained
The MACD is a variant of the exponential moving average that helps traders forecast when to enter or exit a trade. It is a trend-following indicator, which can also be used to determine the underlying momentum behind a trend.
A MACD is comprised of three components:
- The fast EMA (normally a 12-day EMA)
- The slow EMA (normally a 26-day EMA)
- The zero line
The MACD measures the difference between the fast EMA and slow EMA and provides buy and sell signals based on when either of the two lines crosses each other or moves above or below the zero line.
It’s shown in a chart below the normal one – making it an oscillator. It also displays a histogram, which represents the difference between the MACD and its signal line, which is the 9-period moving average of the MACD itself.
The MACD can be used on multiple timeframes ranging across minutes, hours, days and weeks. The common timeframes are daily for short-term traders and weekly for longer-term traders. Some traders use the MACD on intraday timeframe charts to capture very short-term moves lasting from minutes to hours.
Learn more about using the MACD
How to set up a moving average on a trading platform
To set up a moving average on our trading platform, all you need to do is open the price chart for your chosen market and select the indicator list at the top of your chart.
Then just search for ‘moving average’ and see the choice of MAs available to you. Finally, click the MA to add it to your price chart.
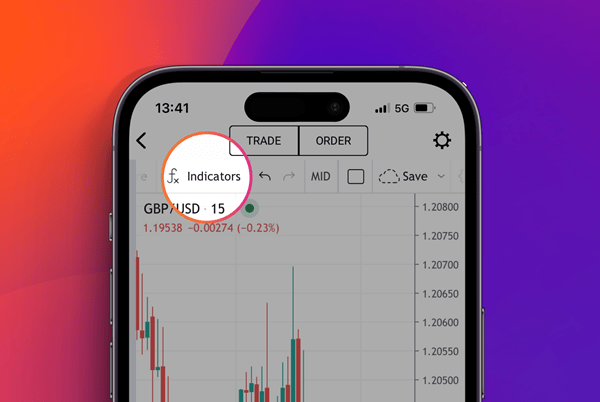
The process is the same whether you’re looking to use our Web Trader platform or mobile app – if you’re using the app, you just need to hit the ‘full screen’ option in the bottom left corner to see your full chart menu.
Moving averages summed up
- Moving averages (MAs) are indicators used to identify price trends
- They use historical prices, making them lagging (not leading) indicators
- Simple moving averages (SMAs) and exponential moving averages (EMAs) are the main two types of Mas
- SMAs calculate the mean of a set of values over a time period
- EMAs do the same but give a greater weighting to more recent prices
- Calculating a moving average involves finding the sum of all the data points and dividing it by the number of data points in the series
- The most common lengths are 10-day, 20-day, 50-day, 100-day and 200-day MAs
- Trading platforms automatically do the calculations for you, whether you’re using a SMA or EMA
- MAs can generate buy and sell signals too depending on when the market price crosses the MA line
- The popular MACD indicator uses different speeds of EMAs as its base to generate buy and sell signals, and momentum
- To set up any type of MA on a trading platform, you just need to select it from the indicator list at the top of your price chart
Start using moving averages with City Index by opening an account or creating a risk-free demo.
Moving averages FAQ
What does a moving average tell me?
A moving average tells you the current price trend for a given asset. An upward trend in a moving average indicates there’s a rise in the price or momentum of the market, while a downward trend in the MA is a sign that the price or momentum is falling.
Learn about the best technical indicators
How can I tell if MACD is bullish or bearish?
You can tell if the MACD is giving bullish or bearish signals based on where the lines cross each other. When the MACD crosses above zero it’s considered bullish, and when it crosses below zero it’s considered bearish.
Learn more about using the MACD
What is a good moving average?
The right type of moving average for you will depend on the period you’re looking to analyse. The most common type of moving average is the 50-period MA because it falls between short and long-term trading.
Discover the types of trading strategies
Latest market news
Today 07:49 AM
Yesterday 01:39 PM
Latest Moving Average articles

September 12, 2023 11:00 AM

August 11, 2023 02:05 PM

July 27, 2022 09:24 AM

Today 07:49 AM