


July 25, 2024 01:30 PM

Indices trading
Trade major global indices including the Wall Street, the Germany 40 and the US SP 500 – plus exclusive thematic indices like the AI index.
-
Range of markets
Access over 20 major global indices with extended trading hours
-
Thematic indices
Take your position on the AI revolution, Big Tech and more
-
Competitive spreads
Trade indices markets with spreads from just 0.3pts
Why trade indices with us?
-
 Gain exposure to global marketsInstead of investing in a single company, trade stock indices for exposure to entire sectors or economies, including energy, banking and mining.
 -
 Profit from falling marketsTake advantage of volatility and benefit from both rising and falling markets.
 -
 Theme-specific tradingOur thematic indices are built to give you exposure to key emerging themes – including AI companies, green stocks and more.
Competitive pricing
Types of indices

Benchmark indices
Trade the headline markets watched around the world – including the US SP 500, Germany 40 and Wall Street.

Thematic indices
Discover themed indices, each based on a basket of equities – including AI shares, green stocks, remote economy companies and FAANGs.
Latest index news
Latest research

July 25, 2024 01:01 AM
July 25, 2024 12:41 AM
July 24, 2024 07:26 PM
July 23, 2024 11:45 AM
No Tweets were found.
Our performance in numbers
0.1
m+
Account holders*
1
k+
Global markets
0
s
Average execution
1
+
Staff
1
+
Partners
*StoneX retail trading live and demo account holders globally since Q4 2020.
Indices trading with City Index
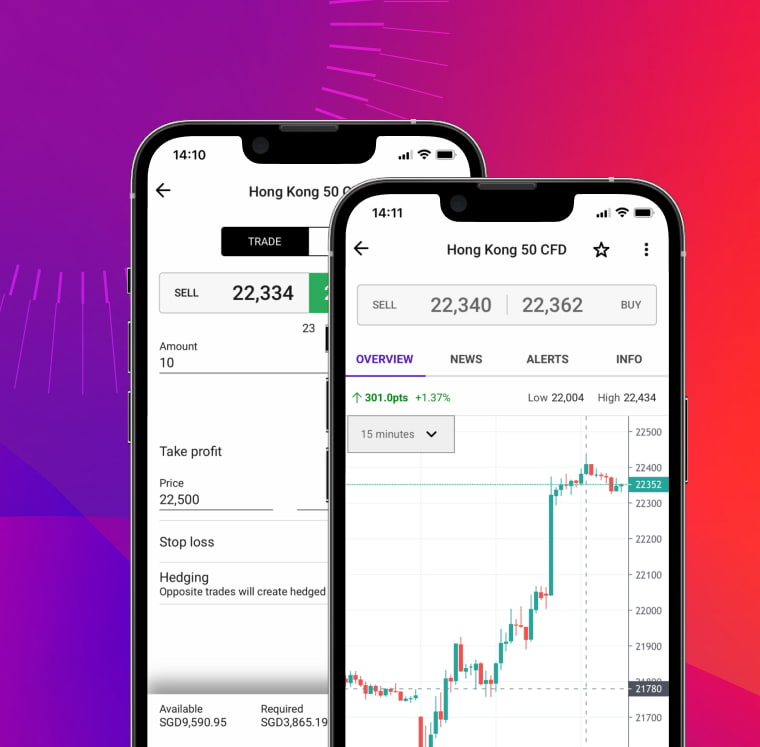
Mobile trading app
Seize trading opportunities with our easy-to-use mobile apps, with simple one-swipe dealing, advanced charting, and seamless execution. Available on Android and iOS.
Portable TradingView chart
Access the industry-leading TradingView charting package, complete with 80+ custom indicators, drawing tools and the ability to trade through charts.
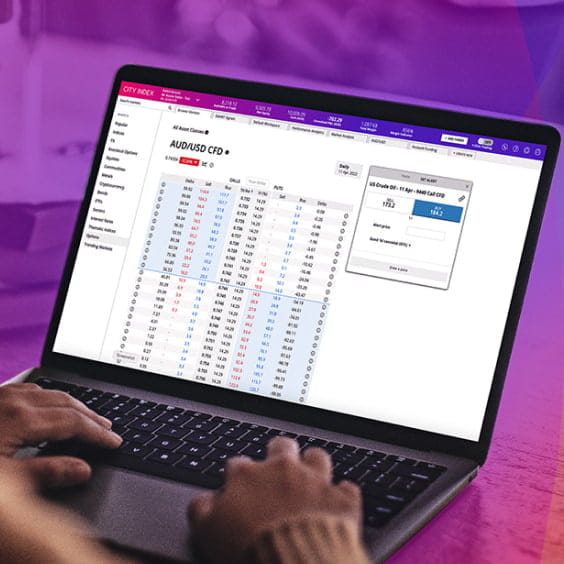
Multi-device dealing
Manage your trading account across desktop, mobile and tablet without interruption.
Actionable market analysis
Receive all the latest market news and expert commentary direct from Reuters in-app.
How to trade indices with City Index
To start trading indices with City Index, all you have to do is open an account by completing our short, secure online form. You could be up and running on live markets in minutes.
If you think an index is going to go up in value, you go long or ‘buy’. If you think an index is going to go down in value, you short or ‘sell’ it. Ready to start trading now? Get started with your application.
Margin and leverage in CFD trading
One of the main features of CFD trading is the ability to trade on margin and utilise leverage. Learn about the benefits and risks here.
Trading indices
Learn how to trade global indices, what affects their price movements, and what to look out for on the economic calendar as an index trader.
Guide to short selling
Learn how to take advantage of falling indices with our comprehensive guide on short selling.
Frequently asked questions
What is a benchmark index?
A benchmark index is a group of stocks that is used as a measure of the market as a whole. Most of the major indices you’ve heard of are benchmarks: including the S&P 500 (US SP 500), Dow Jones (Wall Street) and FTSE 100 (UK 100).
Benchmark indices are useful to traders as a way to compare an individual security against the wider market. For example, say that you’ve found a US stock that has grown 20% over the past four years. You might compare that growth to the S&P 500 to see how it fares against 500 of the biggest US stocks.
If the S&P 500 has grown 40% over the past four years, then your stock has actually underperformed the wider market.
Was this answer helpful?
What's the best way to trade indices?
There are multiple ways to trade indices, including via futures and CFDs. Each has its own benefits and drawbacks, so it’s worth doing your research to decide which works best for you.
Trading index CFDs with City Index, for example, enables you to go long or short on 20 major global indices.
Was this answer helpful?
What are indices used for?
Indices are used in a variety of ways by traders. They can give an instant idea of how a country’s economy is performing, can provide a useful way of assessing multiple stocks at once and provide lots of powerful trading opportunities.
Indices were created for the purpose of evaluating the performance of a stock market. If an index is rising, it means that the stocks it represents are moving up overall, generally a sign that businesses are doing well and economic health is strong. A falling index, on the other hand, is a signal that stocks are struggling, which may hint at deeper problems within an economy.
Stock indices are still used for this purpose today, but they’re also a popular asset class in their own right. It isn’t hard to see why – they enable you to take your position of the biggest stocks in an economy with a single trade, as well as offering high volatility and liquidity.
Learn more about how indices work.
Was this answer helpful?
Indices trading explained
What is an index?
An index measures the collective price performance of a group of shares, usually from a particular country. Indices are often used to track and compare the performance of stock markets.
The performance of each index is dictated by the performance of the underlying share prices that make up that index. An index is constructed and calculated independently, sometimes by a bank or by a specialist index provider like the FTSE Group. The choice of the companies included in the index is determined by index calculation rules or by a committee. Not all indices use the same rules, however.
DNA of a stock market index
Price-weighted indices
The index is calculated by adding together the share price of each stock in the index and then divided by the number of stocks in that index. Higher priced stocks exert more influence on the performance of the index. The Dow Jones Industrial Average is an example of a price-weighted index.
Market capitalisation weighted indices
The index is calculated by adding up the market capitalisation of each stock and then dividing by the amount of companies. Larger companies with a higher market cap will exert more influence on the performance of the index. The FTSE 100 is an example.
Composite indices
Composite Indices provide a statistical measure of a market or sector’s performance over time. They are useful for measuring an investor’s portfolio performance. They may be price-weighted or market capitalisation weighted. The NASDAQ is an example of a composite index as it measures the performance of an index that is heavily weighted towards technology stocks.
Benchmark indices
Sometimes you will hear journalists and analysts refer to a market’s benchmark index – this is the index most commonly used to track where a particular market is heading. A few of the main ones include:
- The Dow Jones (Wall Street) – the Dow Jones Industrial Average, the original stock market index, was created by Charles Dow in 1884. It follows the price of the 30 biggest companies on the New York Stock Exchange.
- Standard & Poor’s 500 (US SP 500) – this is the most widely tracked measure of the US stock market. It tracks the prices of the biggest 500 companies listed on the New York Stock Exchange and the NASDAQ.
- FTSE 100 (UK 100) – launched in 1984, the FTSE tracks the prices of the biggest companies by market capitalisation listed on the London Stock Exchange.
- Nikkei 225 (Japan 225) – this is the main stock market index for Japan, tracking the shares of 225 companies listed on the Tokyo Stock Exchange.
- Euro Stoxx 50 (EU Stocks 50) – this index was created to follow the prices of the biggest 50 shares in the Eurozone countries.
- DAX (Germany 40) – founded in 1988, the DAX follows the shares of the largest 40 companies listed on the Frankfurt Stock Exchange.
- CAC (France 40) – tracks the largest 40 companies listed on the Paris bourse.
- ASX (Australia 200) – the benchmark index for the Australian stock market is the ASX 200, which follows the prices of the 200 largest companies listed on the Australian Stock Exchange, ranked by market capitalisation.
What moves indices?
Indices tend to be affected by broader market movement which affects the price of many companies. Typical examples include:
- Political unrest or uncertainty
- Economic data – e.g. inflation statistics or unemployment numbers
- Changes to interest rates
- Good or bad news affecting several big companies in the same industry– e.g. mining or banking
- The performance of the shares within that index