


WTI Crude Oil Talking Points:
- Oil prices were rejected at resistance this week and pushed back-below the 200-day moving average.
- From the daily chart there’s now an ascending triangle formation with resistance just inside of the $80-handle, and that keeps the door open for bullish breakout potential.
- Support in oil has recently held the $75.61 Fibonacci level and that remains a spot that buyers would want to hold to keep the door open for topside breakouts.
- I’ll be discussing these themes in-depth in the weekly webinar. It’s free for all to register: Click here to register.

All in all, it’s been a pretty slow three months in oil markets. After a decisive bearish trend drove WTI from above $90 to below $70 in late-2023 trade, bulls have continued to show some element of support, even if it has been slow. There’s been an inability for buyers to push above the $80 handle, and that’s led to a grinding range over the past few months, although there could be a bullish bias as derived from the recent pattern of higher-low support, shown on the weekly chart below.
Also of interest here is the 200-day moving average, which has come back into play over the past month. Bulls have continually tested above this level, but they’ve lacked the ability to drive trends beyond up to this point.
WTI Crude Oil Weekly Price Chart
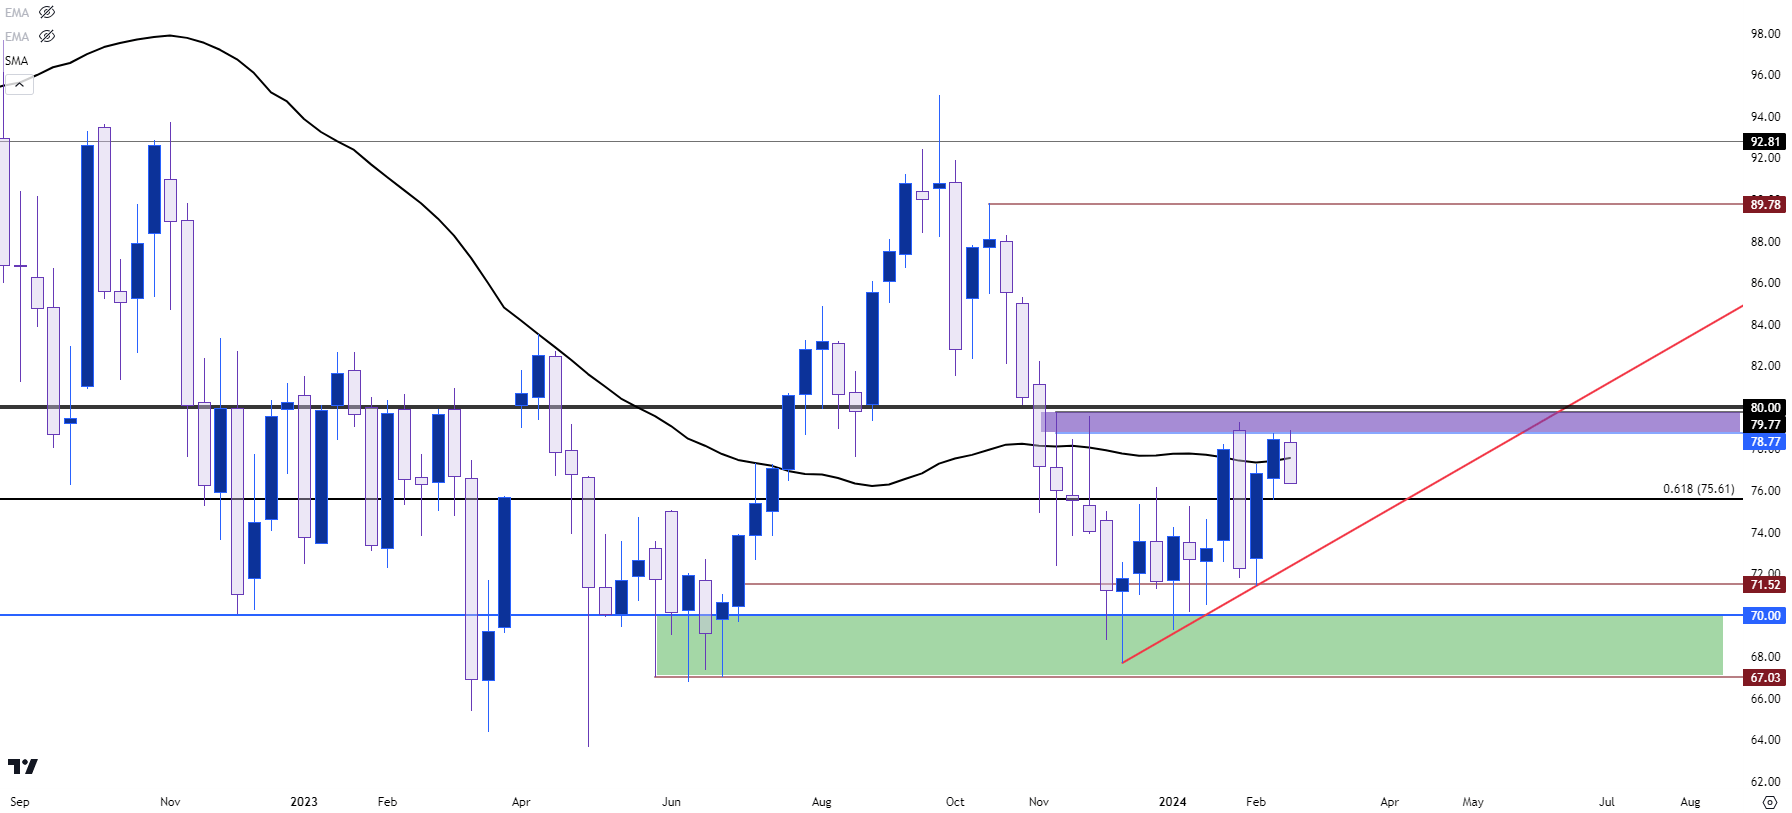 Chart prepared by James Stanley; data derived from Tradingview
Going down to the daily chart shows this as an ascending triangle formation, which would keep the door open for bullish breakout potential. For that scenario, defense of the upward-sloping trendline would be key and there’s another spot of possible support to investigate before that might come into play, and that’s the 75.61 level which is the 61.8% Fibonacci retracement of the long-term move in oil, which I’ll look at a little later.
WTI Crude Oil Daily Price Chart
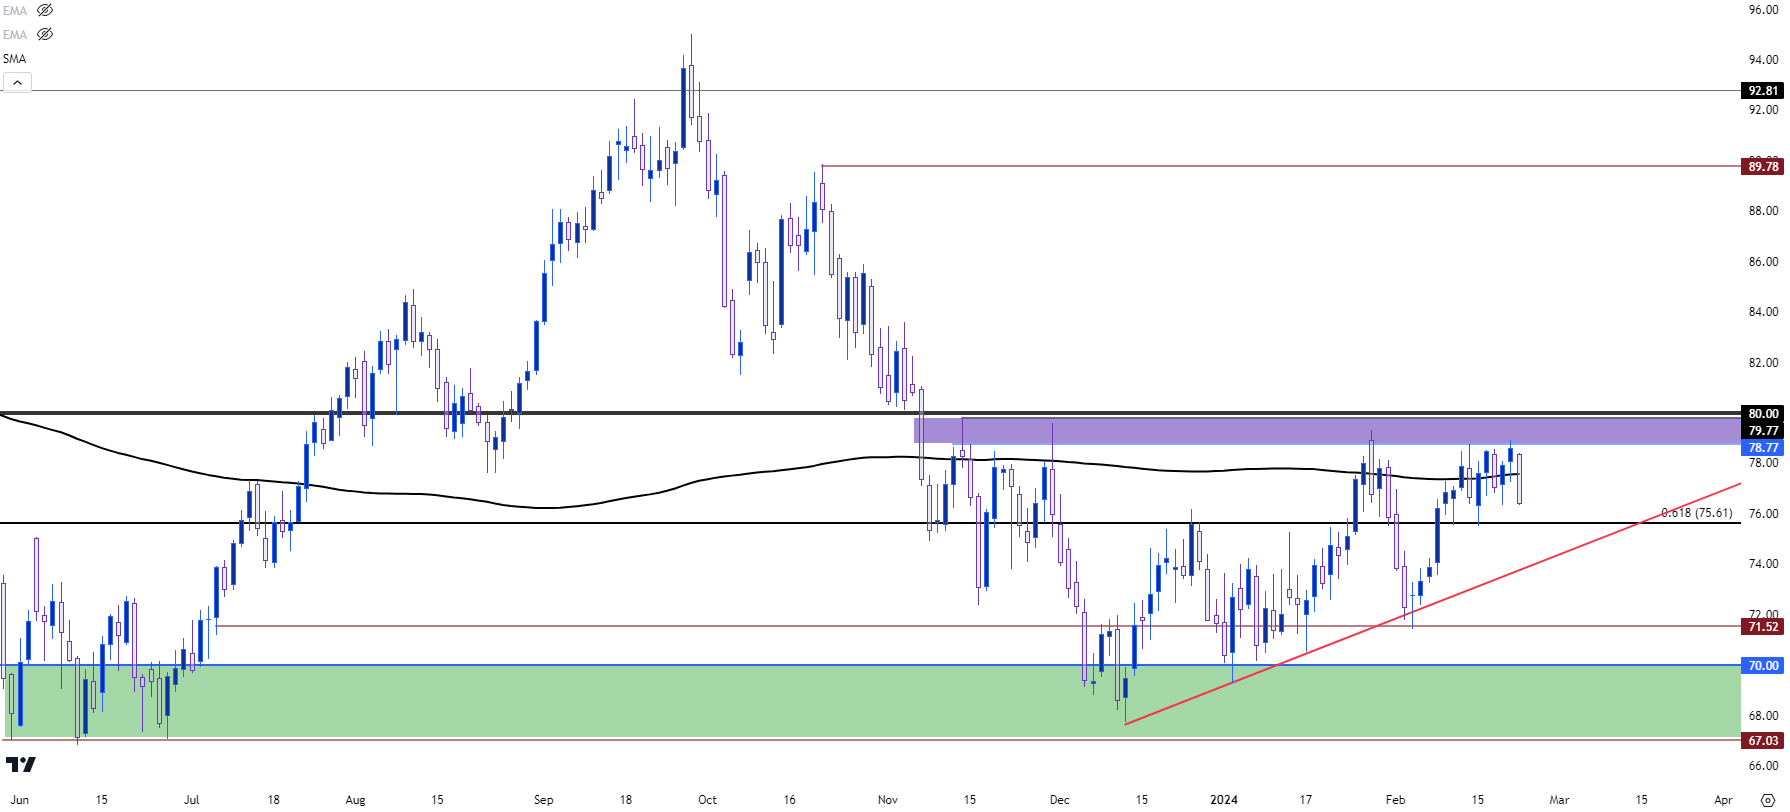 Chart prepared by James Stanley; data derived from Tradingview
Crude Oil Longer-Term
Given the potential for bullish trends if price can push over the 80-handle, it’s worth looking at some historical scope given the importance of that price. While there’ve been multiple episodes of price trending over the 80-handle over the past few years, there have also been several inflections in that zone, specifically looking from the $75 to the $80-handle.
WTI Crude Oil Monthly Price Chart
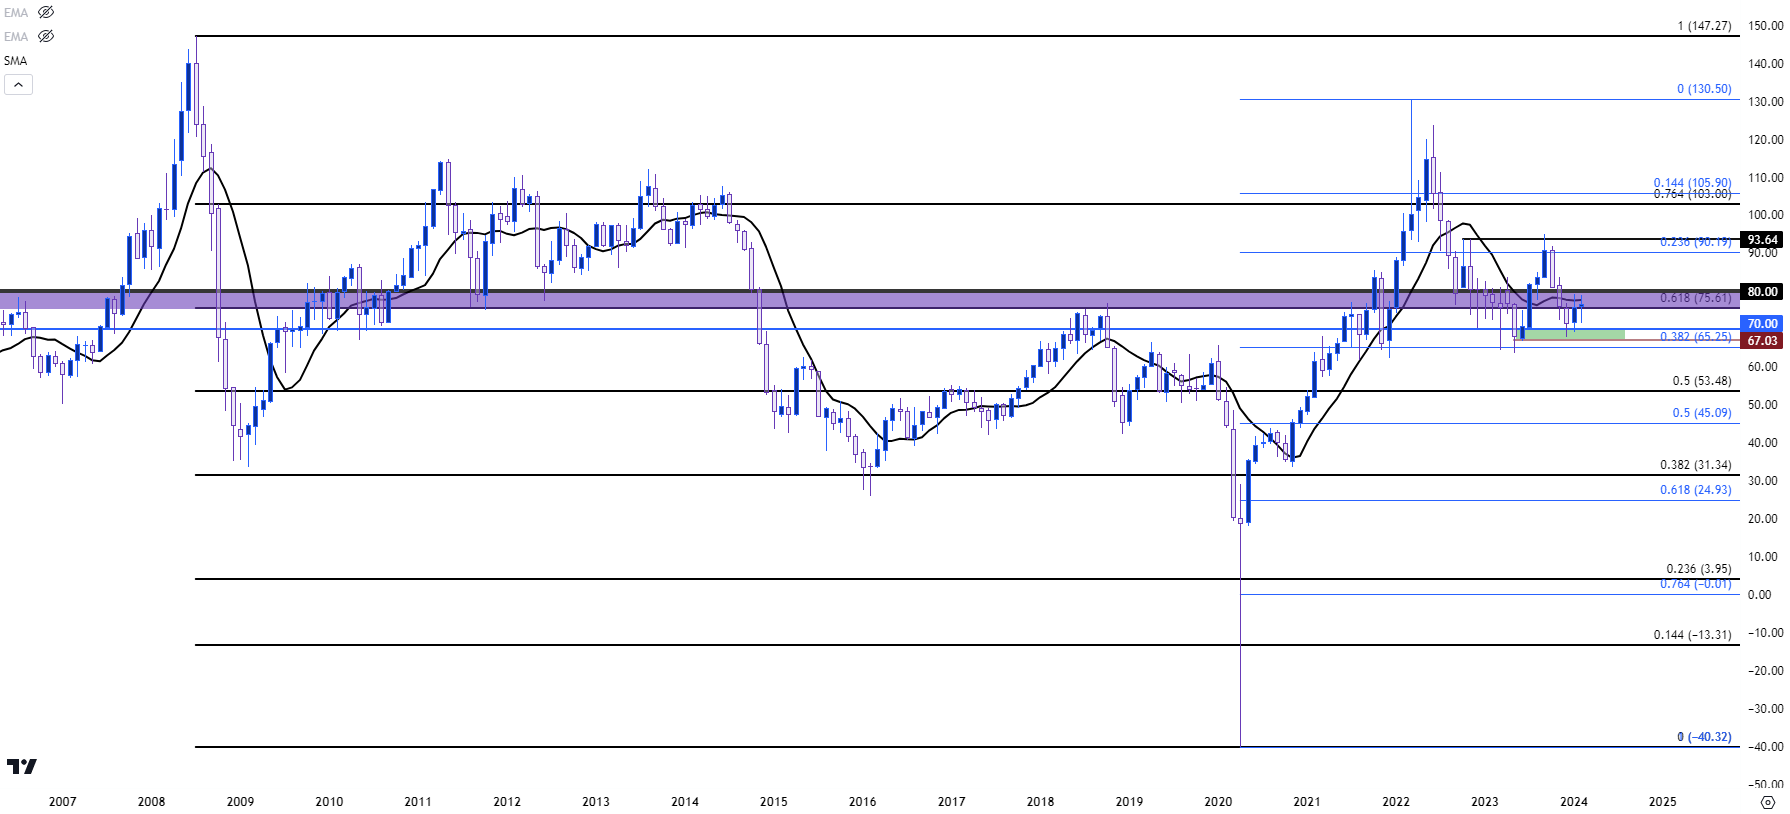 Chart prepared by James Stanley; data derived from Tradingview
Crude Oil Short-Term
Going down to the four-hour chart highlights the importance of that 75.61 level, which had helped to set support twice over the past couple of weeks. If sellers can elicit a break below that, then the next spot of potential support would be around the trendline projection, which for next week would align with around the $74 level.
On the resistance side, there’s a prior swing taken from the daily chart around 78.77 which has also shown multiple inflections over the past couple of weeks. That would be the first spot for bulls to contend with, after which the 79.77/80 level would come into view.
If buyers can force a break of the 80-handle next week, that could end up being a difficult move to chase as it would be the first test above the big figure in more than three months. Instead, looking for a pullback to support at that level, with a show of response from bulls, could open the door for bigger-picture bullish trend potential.
WTI Crude Oil Four-Hour Chart
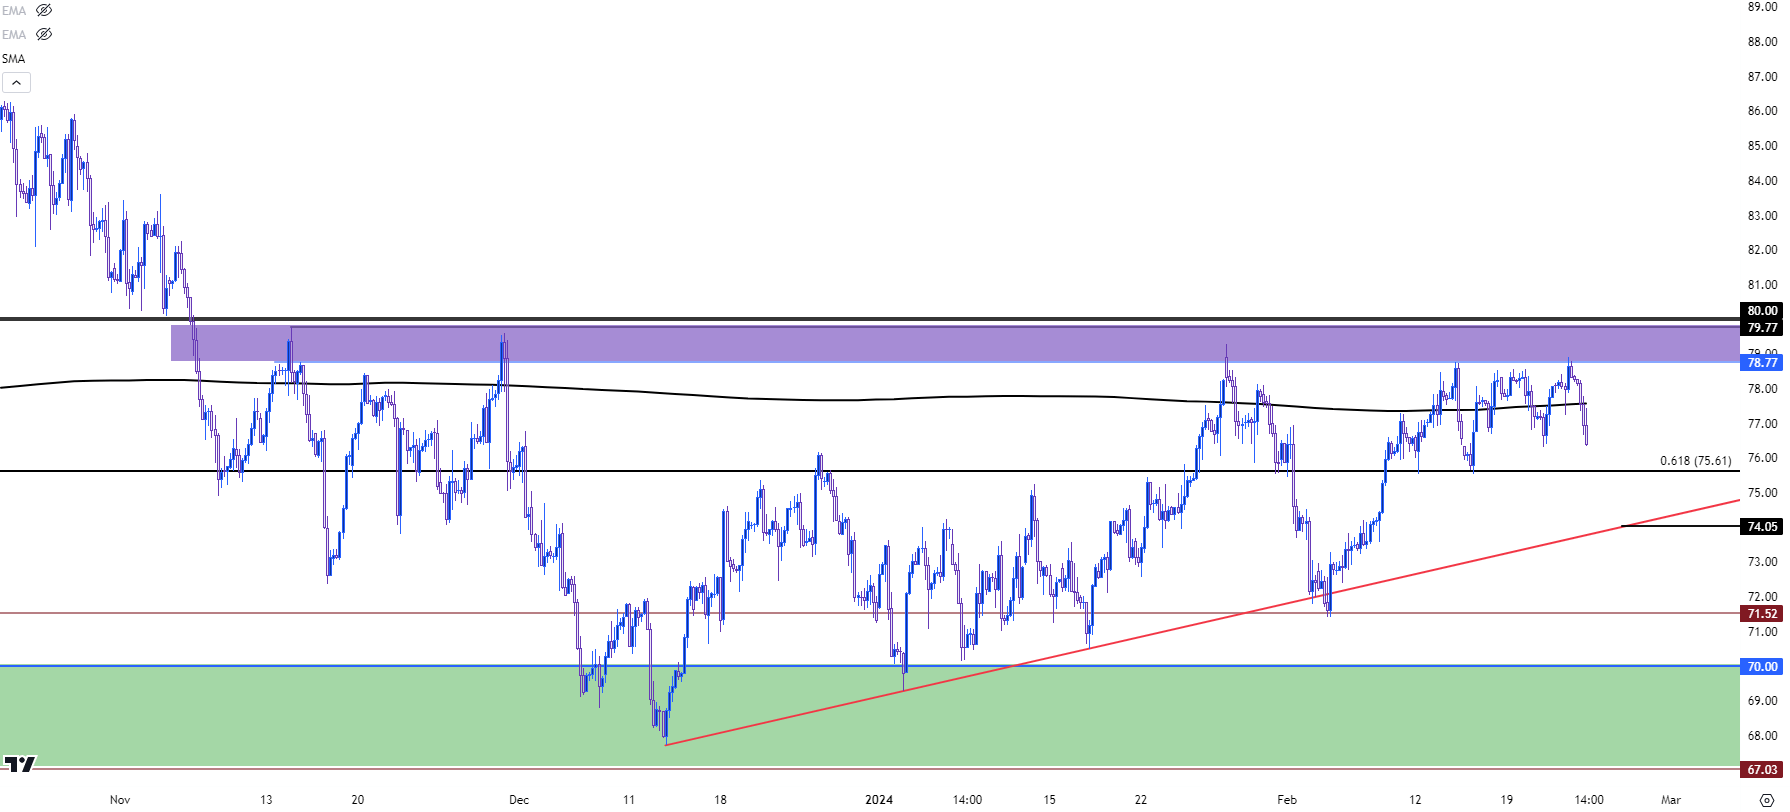 Chart prepared by James Stanley; data derived from Tradingview
--- written by James Stanley, Senior Strategist
Latest market news
Yesterday 06:37 AM
April 26, 2024 01:25 PM
April 26, 2024 11:40 AM
April 25, 2024 03:09 PM
April 25, 2024 03:00 PM
Latest Trade Ideas articles

April 26, 2024 11:40 AM

April 25, 2024 03:00 PM

April 25, 2024 11:14 AM
April 24, 2024 11:00 AM