


US Dollar Talking Points:
- It’s been another week of strength for the US Dollar, with the currency working on its ninth consecutive weekly gain.
- The big item on the horizon is the FOMC rate decision next week, but we also get European and Canadian inflation figures on Tuesday, and rate decisions from the UK and Japan on Thursday.
- I’ll be discussing these themes in-depth in the weekly webinar on Tuesday at 1PM ET. It’s free for all to register: Click here to register.
It’s been another week of strength so far for the US Dollar and the currency caught another shot-in-the-arm on Thursday after the European Central Bank rate decision. While the ECB did hike rates, they also indicated that it may be the last and the net response was a rate-hike sell-off in EUR/USD. The pair pushed down to the support that I had outlined in the Tuesday webinar and that’s holding the low as we move into the end of the week.
But next week brings the big one with the FOMC rate decision on Wednesday. The Fed is widely expected to hold rates at that meeting but more debatable is what they might do in their final two meetings for the year. As of right now it’s about 40% for another rate hike and the way that US data printed this week illustrates why that remains the case. Both PPI and Retail Sales data showed extreme strength in the US economy, and those reports came out just the day after headline CPI showed another strong jump last month, to 3.7% from a prior read of 3.2%.
This speaks to what the Fed has referred to in the past regarding inflation re-accelerating. The bank has merely slowed their tightening over the past six months and not only has inflation failed to draw down, but it’s also actually started to go back up.
This should be something that concerns the bank but on the same token, illustrating too much worry at this point could create its own series of problems, so this seems like one of those rate decisions where Chair Powell attempts to strike a balanced tone, instead looking to get more data before taking a more affirmative direction regarding policy disclosure.
Nonetheless, given the deviation in data between the US and Europe, that could still allow for bullish scope in the USD, largely on the back of lower rate expectations from other economies. We heard some of that during the ECB rate decision when it was hinted that this may have been the last rate hike out of the ECB and we’ll get more on that topic on Tuesday when we get to see European inflation figures.
In USD, price remains above the 105 level which is a key spot on the DXY chart. The next major level of resistance is at the 2023 high plotted at 105.88, and support structure remains on the USD down to the 104.31 level.
US Dollar - DXY Weekly Price Chart (indicative only, not available on Forex.com platforms)
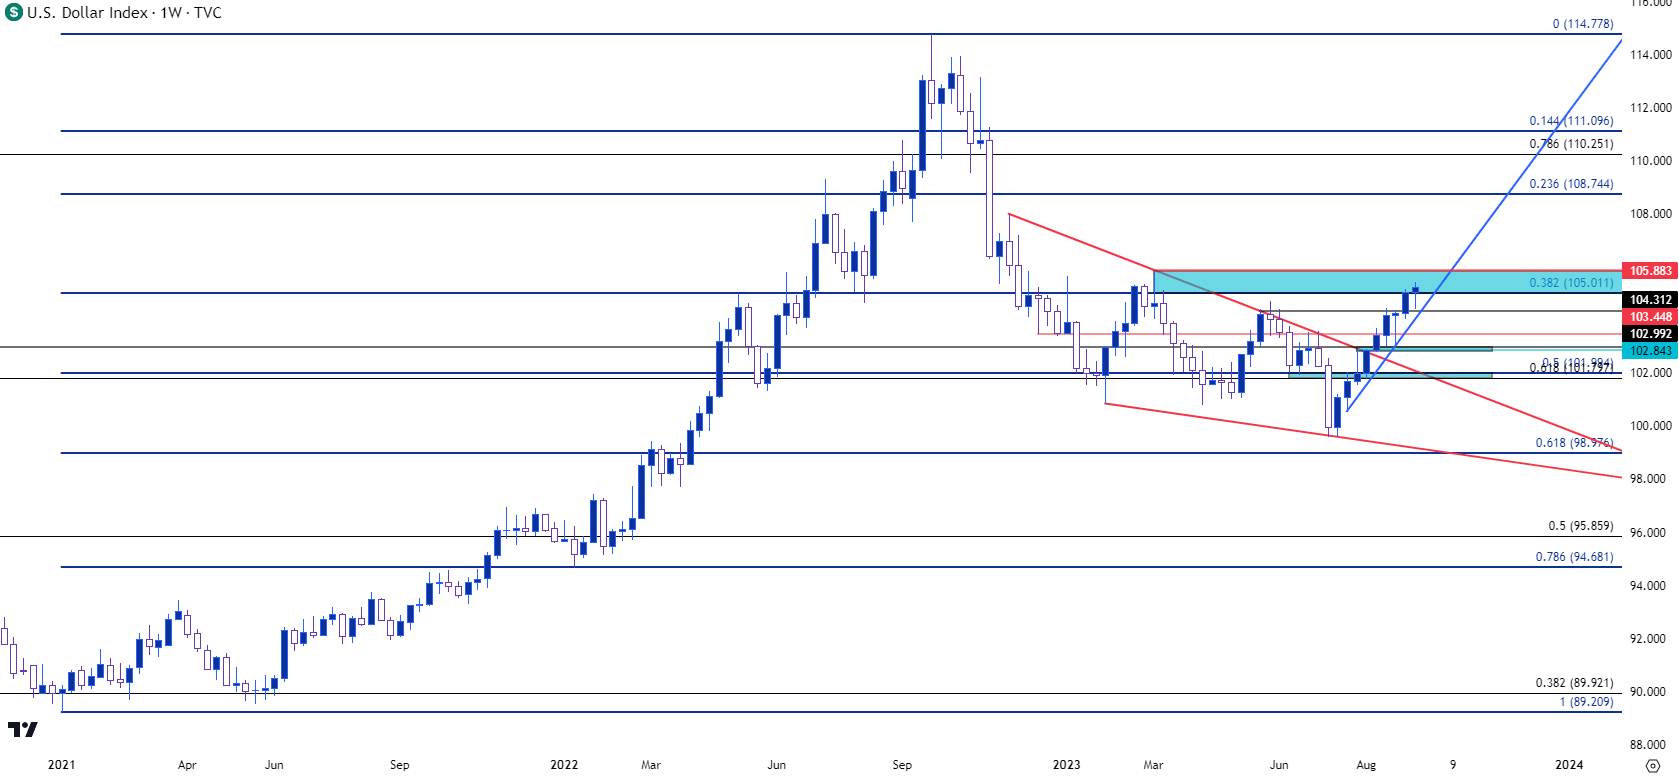 Chart prepared by James Stanley; data derived from Tradingview
US Dollar Shorter-Term
The 105 level remains of issue for the US Dollar, and this has been the case for a couple of weeks now. That price started to come into play the week before and held the highs into the end of last week. This week began with a strong pullback, but as we’ve seen multiple times over the past two months USD bulls quickly returned to show support at prior resistance before continuing the move.
The Thursday ECB meeting helped to push the USD back into that zone but similarly there’s been a lack of follow-through pressure from bulls, indicating that there could still be another pullback before buyers are ready to re-test that 105.88 level.
For this week, higher-low support showed at a point of prior resistance, plotted at 104.45. This keeps the door open for higher-low support at the 104.70 level that can keep the aggressively bullish trend in-play.
US Dollar - DXY Daily Price Chart (indicative only, not available on Forex.com platforms)
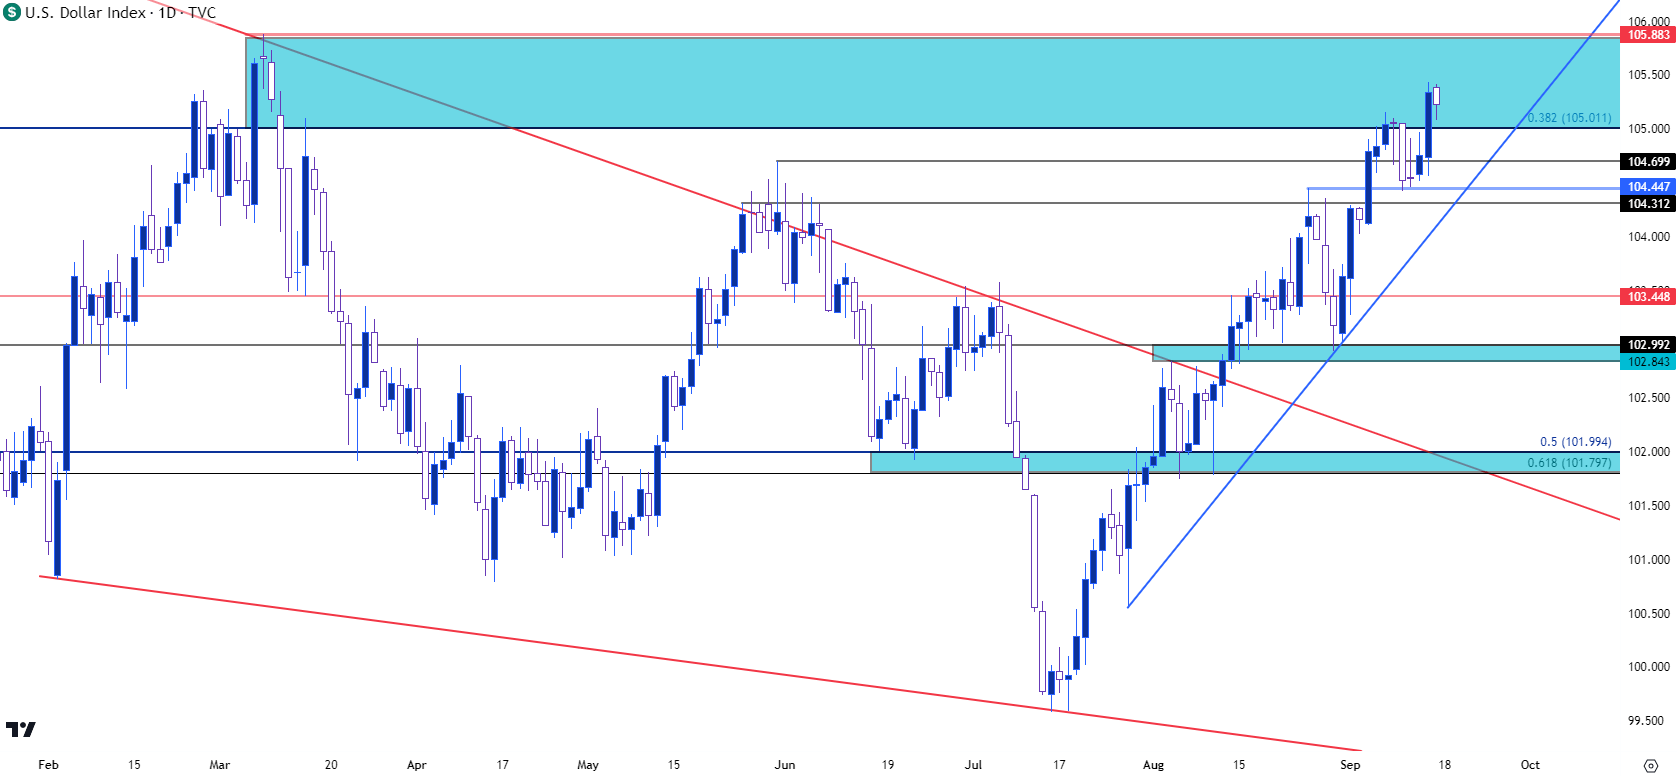 Chart prepared by James Stanley; data derived from Tradingview
EUR/USD
It was another brutal week for the Euro and EUR/USD just pushed its ninth consecutive weekly loss, a fact that’s somewhat related to the similar mirror image scenario looked at in the USD.
And while there was one other instance of the USD being up for nine consecutive weeks back in 2014, the same cannot be said for EUR/USD, which saw its similar streak ten years ago end at eight weeks.
The big driver over the past week was the ECB rate decision and that furthered the theme that’s been getting priced-in over the past couple of months as European data has continued to weaken. This shows deviation between the US and European economy, which keeps the door open for more hikes out of the US whereas that door appears to be closing in Europe, and that helps to explain the consistency that’s shown in the recent sell-off.
At this point a big area of support has come into play at 1.0638. I had talked about this level on the Tuesday webinar as it was the swing low from March of 2020 that came back into the picture in May to hold the low in the pair. This price traded after the ECB rate decision – and it held the lows through the Thursday close and into Friday trade.
At this point EUR/USD bulls seem very reticent to push too hard as prior support at 1.0689 looms overhead.
EUR/USD Two Hour Price Chart
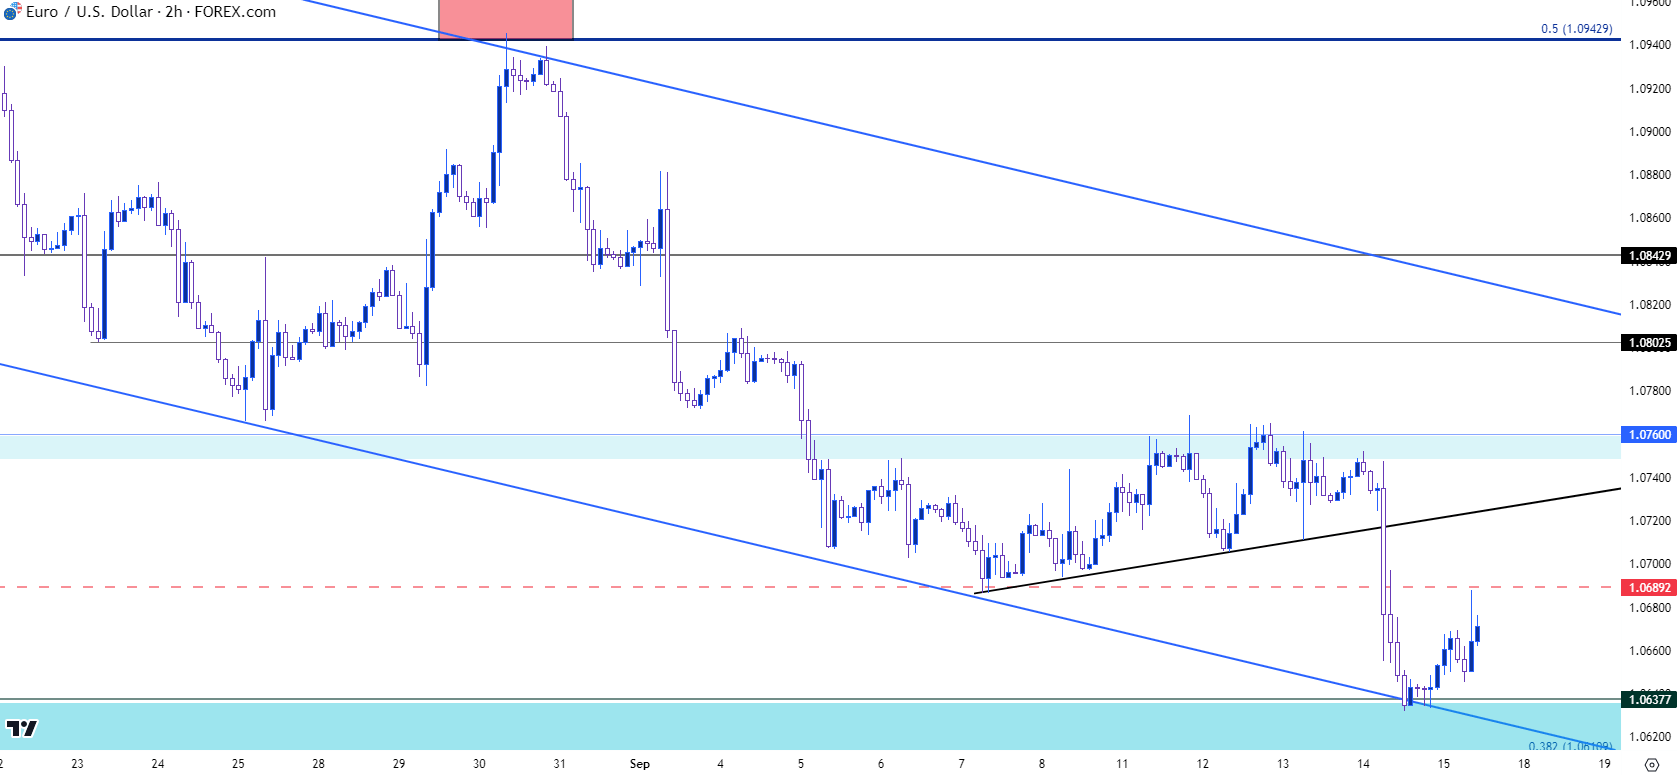 Chart prepared by James Stanley, EUR/USD on Tradingview
EUR/USD
From the daily chart below, we can see a few additional levels of note. If bulls can force a break back above the 1.0700 handle, the next spot of interest would be the 1.0760 level that held the highs over the past week.
For support, the 1.0638 level is very nearby the 1.0611 level, which creates a zone at the current lows. If bears can force a break below that, there’s another major zone around the 1.0500 handle that was last in-play in March, just before the banking crisis came to US markets.
EUR/USD Daily Price Chart
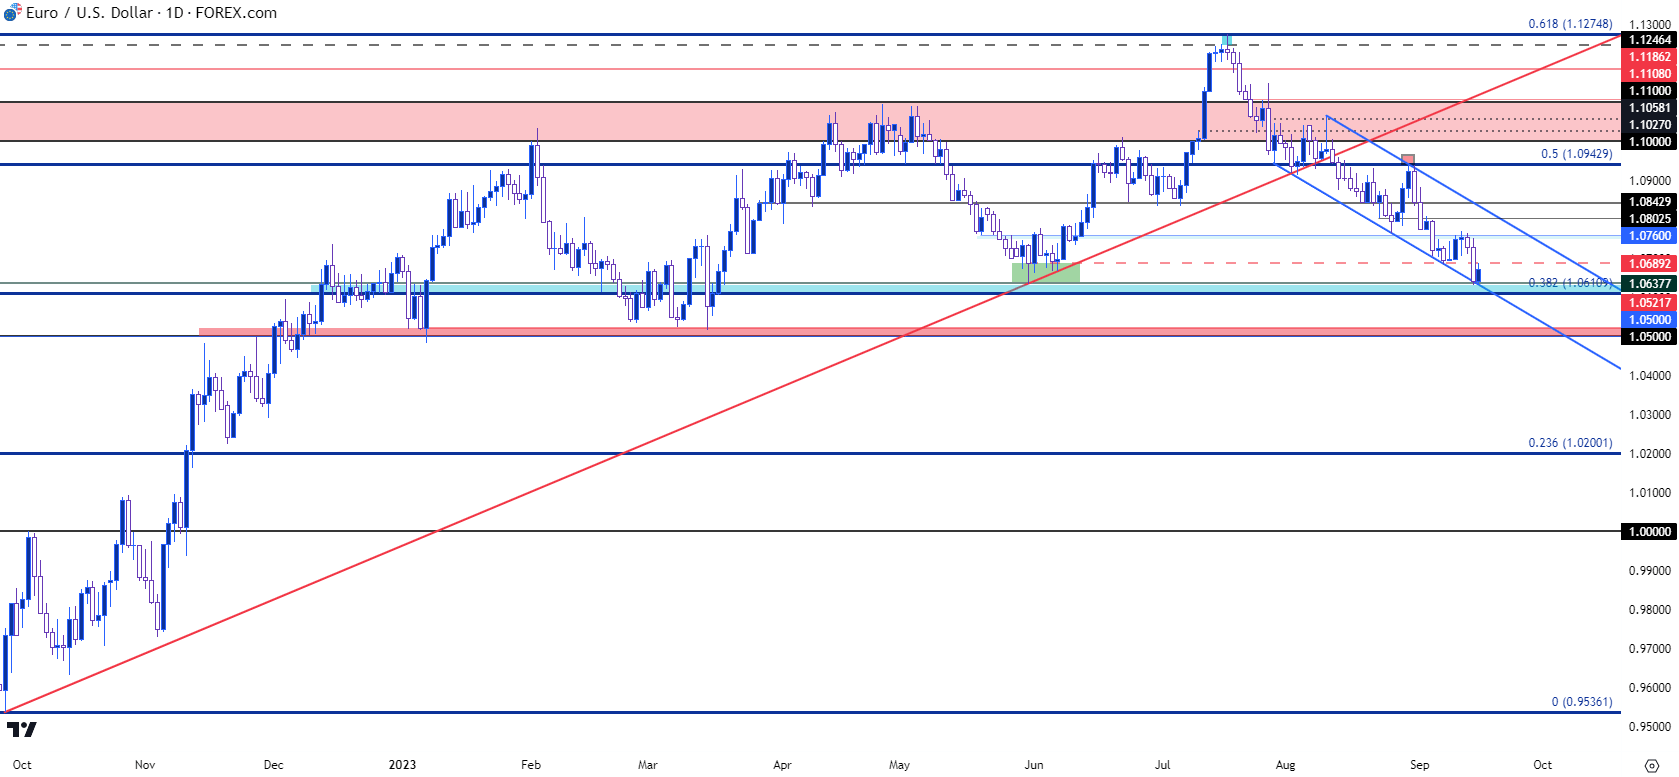 Chart prepared by James Stanley, EUR/USD on Tradingview
GBP/USD
The Bank of England is expected to hike rates next week while the Fed is not, yet the GBP/USD pair has remained mired in a similar bearish slump as EUR/USD above. Inflation remains a problem, but growth isn’t exactly inspiring so there’s the very real concern around the Bank of England’s ability to continue to fight and tame inflation.
In GBP/USD, the pair slipped to another fresh three month low over the past week and that took place after an early-week bounce found resistance at prior support, plotted at 1.2548. There’s a trendline projection that’s now in the picture, and another support level a little lower, plotted around the 1.2344 level that was last in-play as support in May.
GBP/USD Weekly Price Chart
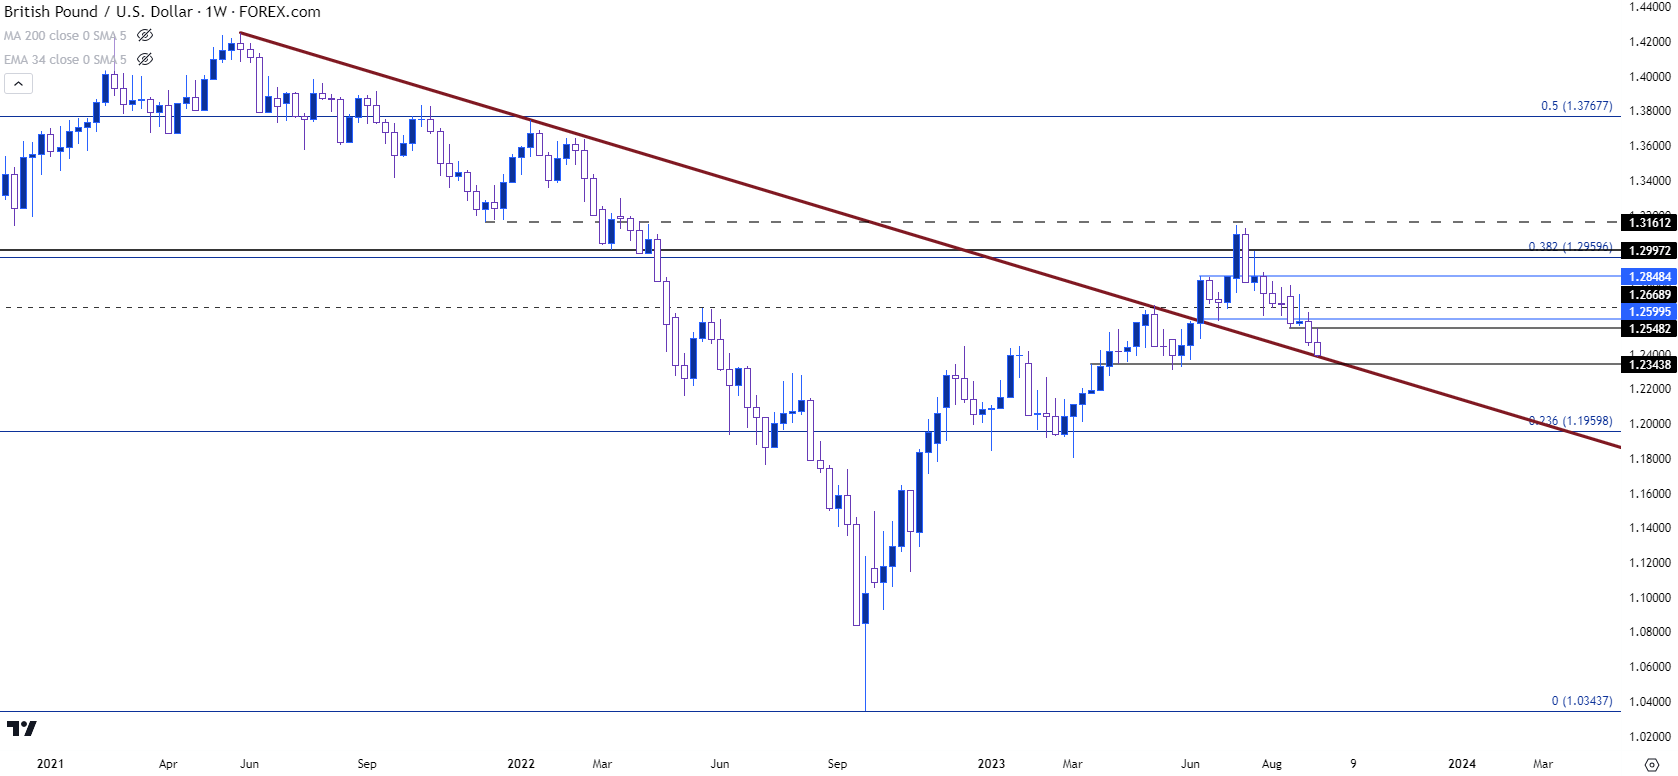 Chart prepared by James Stanley, GBP/USD on Tradingview
Gold
Gold prices spent the early portion of the week threatening breakdown. And there was even a bit of that starting to show on Thursday morning when spot gold prices tipped-below the 1903 Fibonacci level.
That move could not hold, however, and after a bullish outside bar printed on the four-hour chart buyers were able to re-take control of the situation. At this point the weekly bar is showing as bullish which helps to illustrate just how forceful that move was after support played-in at 1903-1910.
I had written about this on Thursday, just after that support had begun to show, and as of this writing buyers have continued to push with another test above trendline resistance, which makes up the topside of a falling wedge formation.
Gold (XAU/USD) Daily Price Chart
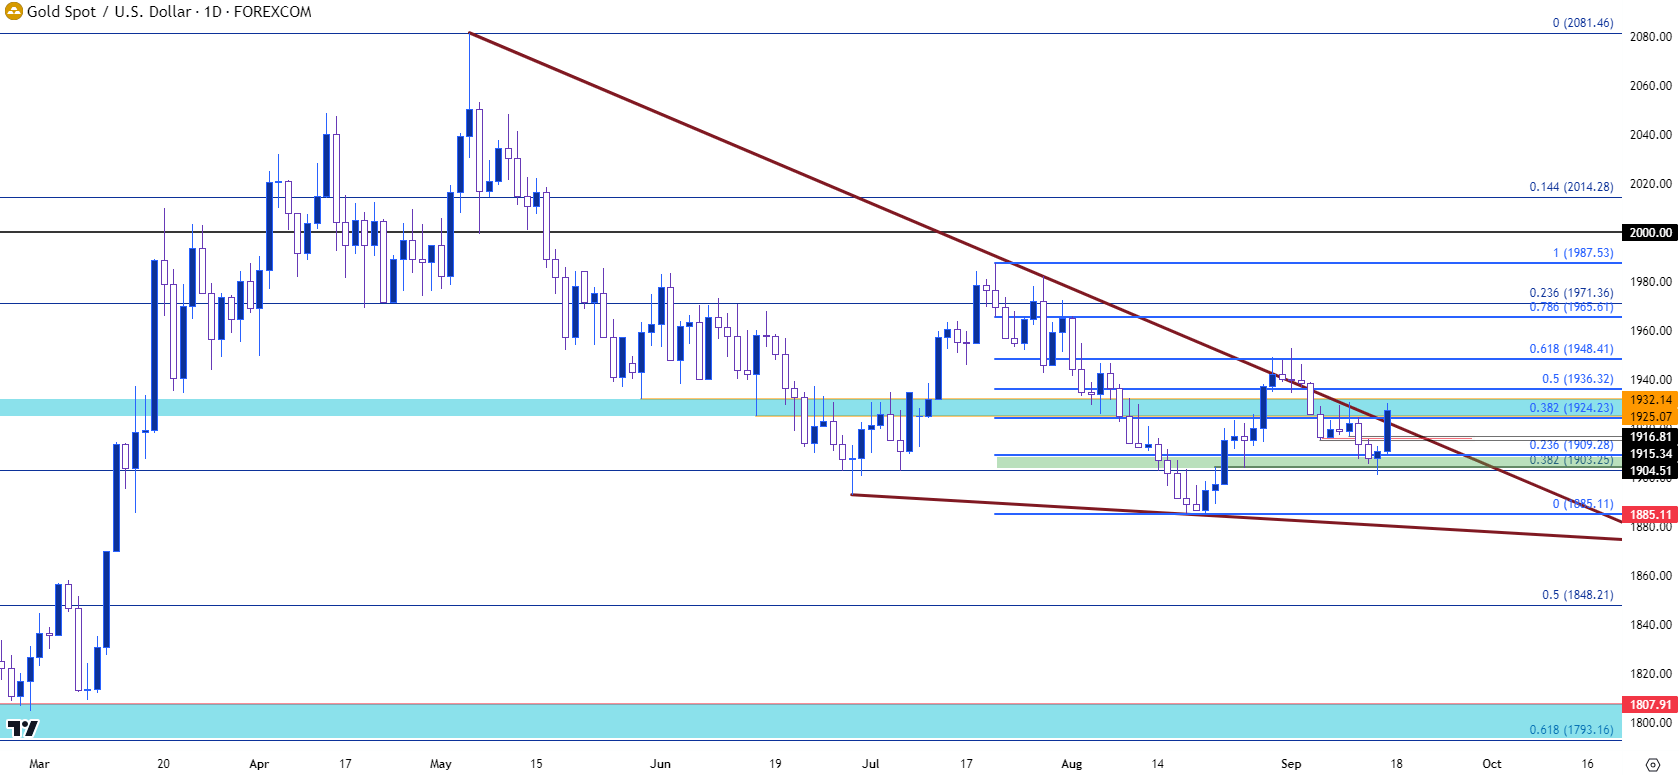 Chart prepared by James Stanley, Gold on Tradingview
USD/JPY
The week opened with more fear behind bullish continuation as there was the mere mention of possible rate hikes out of Japan. And that’s fresh on the heels of an intervention warning last week; and both of these items were able to prod a pullback in USD/JPY.
But, as I discussed on Tuesday this didn’t appear enough to yet reverse the trend and by the end of the week bulls were already probing a fresh high in the pair. This does get to be a somewhat dangerous equation, however, as it appears that it’s just a matter of time before we get another warning, or perhaps even more than that, a full-blown intervention. The carry is still tilted decisively to the long side of the pair so as long as there’s a bullish argument to be had for the US Dollar, that carry can remain an attractive driver.
That changes when the Bank of Japan makes a forceful re-entry into the matter, such as we saw last October. And if there’s the prospect of weakness in the US Dollar, that could similarly help to drive reversal themes such as we saw last November and December. But it does not appear that we are there yet.
The current weekly bar in the pair is showing as a dragonfly doji with the indecisive body showing right at that spot of prior resistance. This could be a difficult spot to chase for bulls and support potential remains around the 145 handle, in the event that a pullback does show in the early portion of next week’s trade.
USD/JPY Weekly Price Chart
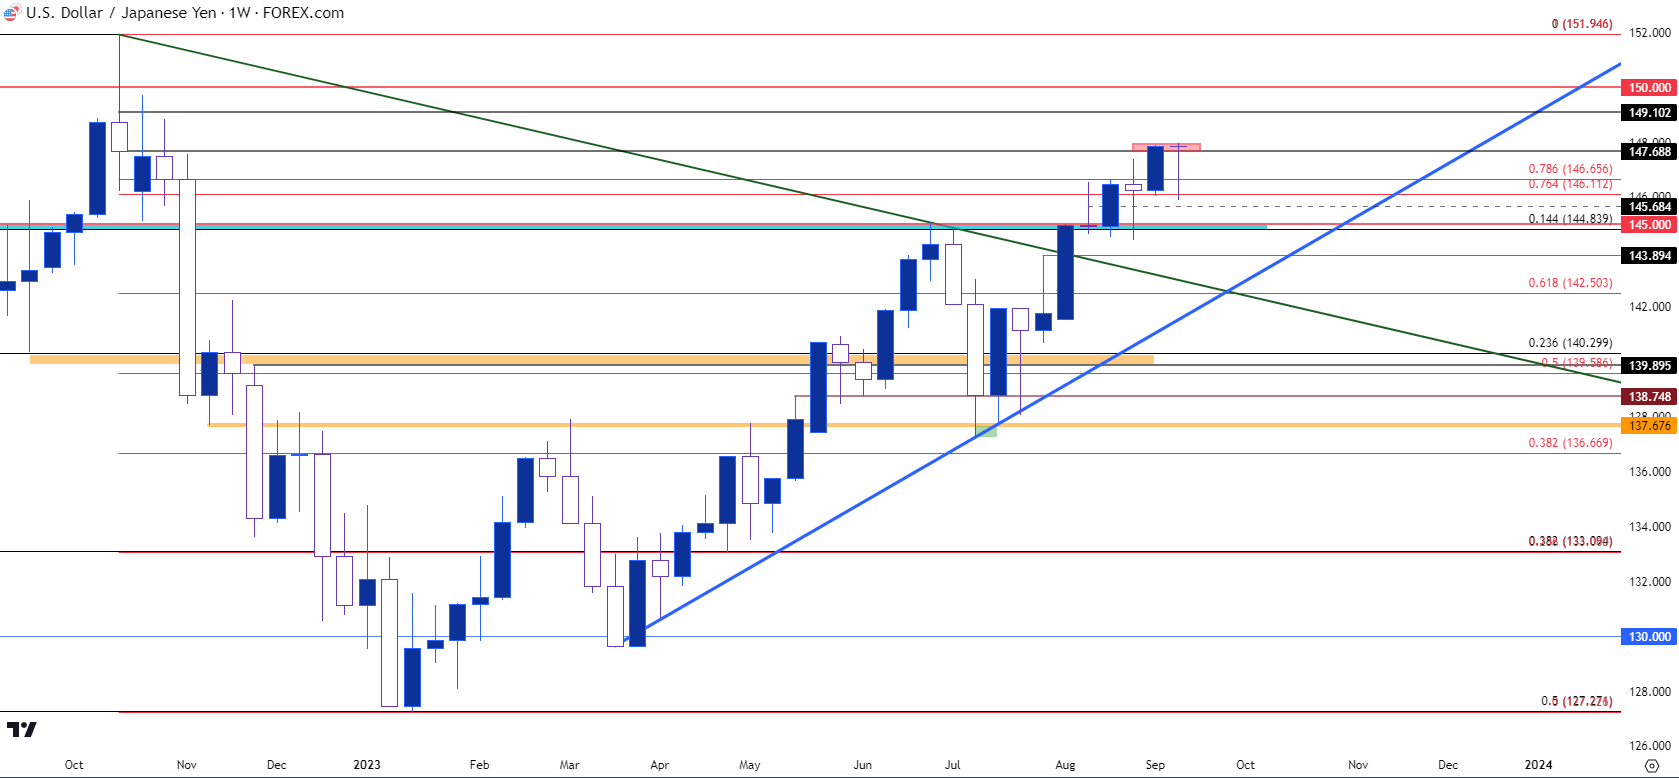
Chart prepared by James Stanley, USD/JPY on Tradingview
--- written by James Stanley, Senior Strategist
Latest market news
Yesterday 01:32 PM
Yesterday 09:35 AM
Yesterday 07:23 AM
Yesterday 04:48 AM
Yesterday 12:17 AM
July 25, 2024 10:39 PM
Latest Trade Ideas articles

Yesterday 09:35 AM

Yesterday 12:17 AM

July 25, 2024 10:39 PM

July 25, 2024 05:30 PM