


Gold, US Dollar Talking Points:
- Gold prices are testing a key spot of support in the 1903-1910 area.
- On a bigger picture basis spot gold prices remain in a falling wedge formation. There’s a big spot of interest overhead at 1925-1932, which was prior support that had turned into resistance late last week. This would be the area that bulls need to take out to re-take control of near-term trends. Until then, the 1900 level sits below current price as the next item of possible support.
- I’ll be discussing these themes in-depth in the weekly webinar on Tuesday at 1PM ET. It’s free for all to register: Click here to register.
Gold prices are trying to break a short-term trend at the moment. The yellow metal had come into September trade with strength, even as the US Dollar had remained strong, as well. But after stalling in the first few days of the month, sellers started to push and over the past two weeks we’ve seen the development of lower-lows and lower-highs on a short-term basis, raising the prospect of fresh bearish trends in gold prices.
That theme is on hold right now as price is testing a key spot of support between two Fibonacci levels at 1903 and 1910. I had looked into this in the Tuesday webinar, and as I shared there, there was short-term resistance potential in the 1915-1916 area. That resistance came into play the morning after and held as a lower-high before sellers pushed towards 1903.
A couple of pieces of data were released at 8:30 AM ET that contributed to a test of fresh lows: US PPI printed at a 0.7% clip against a 0.2% expectation, and Retail Sales came out at 0.6% against a 0.2% expectation. Both items were very strong data prints, and this brought a quick run of USD-strength, which helped to show a support test and a fresh low in gold.
But that’s since been pared back as we can see a bullish outside bar on the four-hour chart below that printed just after those data items were released.
Spot Gold (XAU/USD) Four-Hour Price Chart
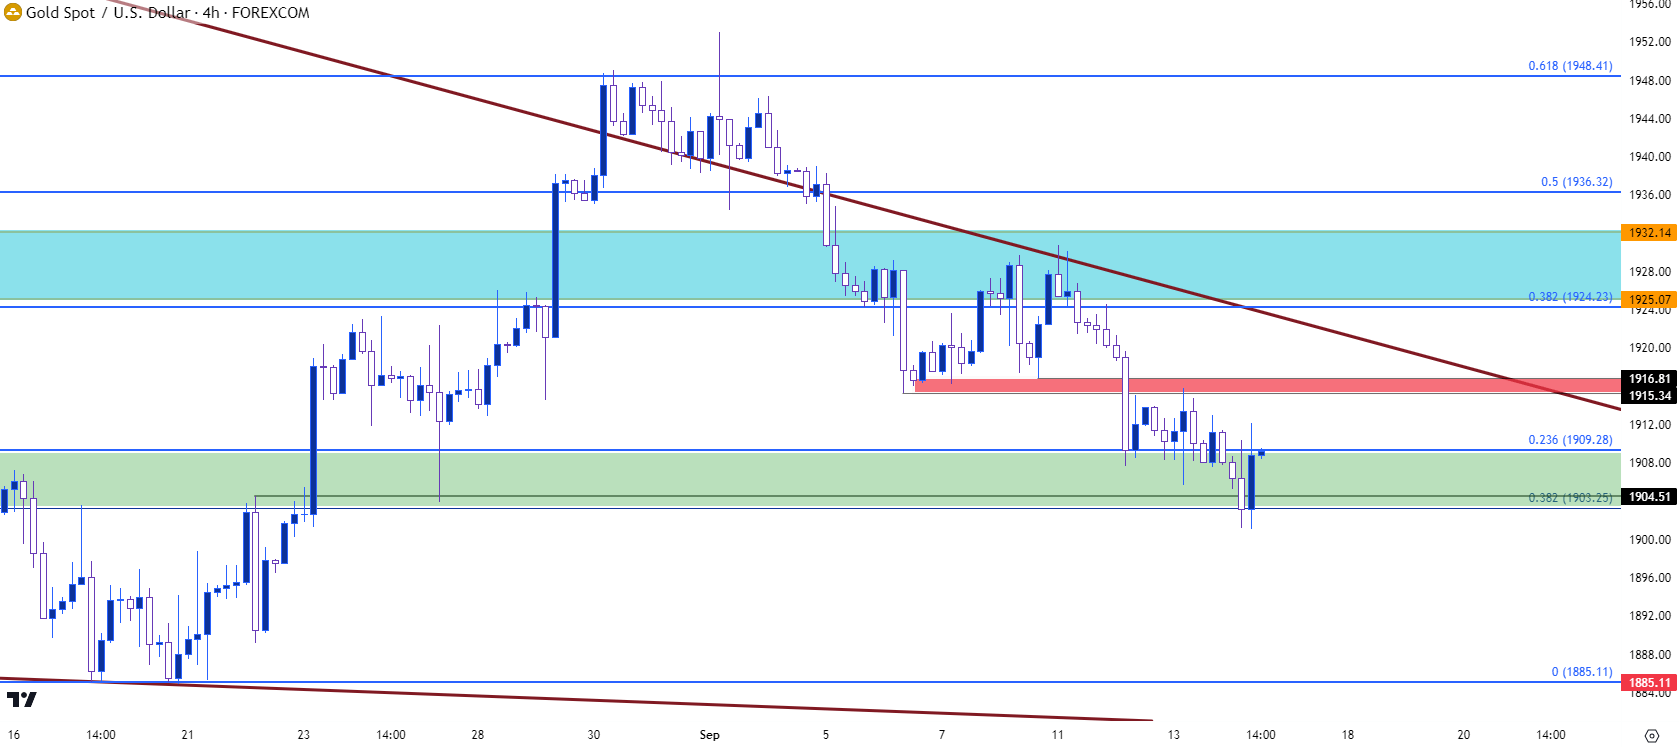 Chart prepared by James Stanley, Gold on Tradingview
Gold Daily
The net of today’s price action has so far been a doji. There is still some time to go so this can change, but an item of indecision after a run from bears could be highlighting bullish swing potential, particularly if this posts at a key spot of support on the chart.
The bigger question is whether bulls can show a greater hand in taking control of the trend. Overhead there’s remaining resistance potential at the 1915-1916 swing that I had looked at in the Tuesday webinar. That spot of prior support soon showed as resistance on Wednesday and, as of this writing, that was the most recent lower-high on the four-hour chart.
From the daily chart, we can see another important area plotted from 1925-1932. This is a longer-term zone, but this had set support in June and resistance in July. Most recently, this area had held the highs after this week’s open with an assist for resistance from the bearish trendline.
If bulls can force a test through that zone, then we’d have a bullish breach of the longer-term falling wedge, which can further support big picture arguments behind bullish trends.
Gold (XAU/USD) Daily Price Chart
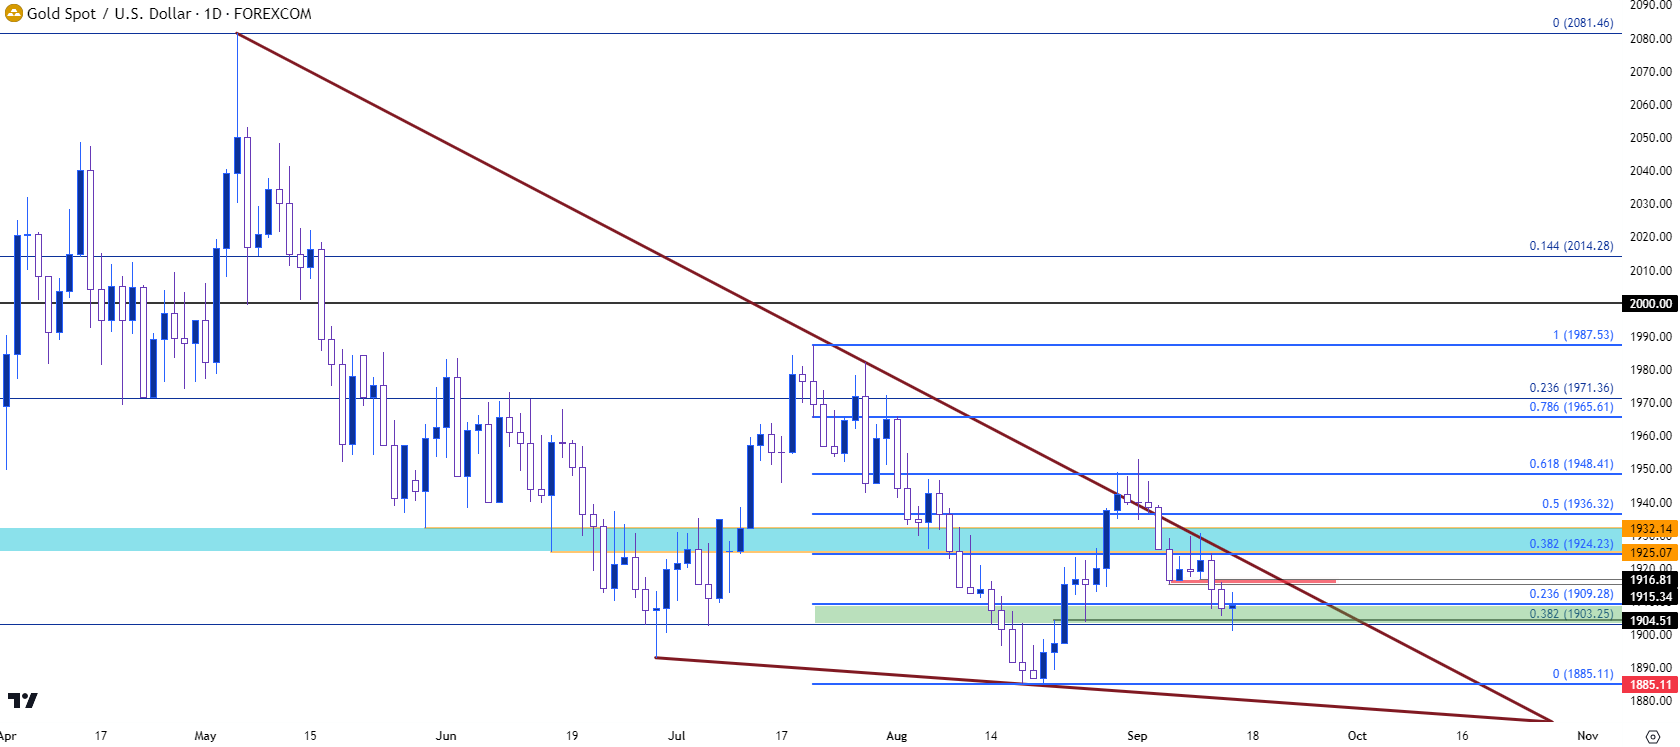 Chart prepared by James Stanley, Gold on Tradingview
Gold: The Bearish Side
Given the backdrop, we could quickly see bearish scenarios re-appear in the big picture behind gold. This would be supported both by the longer-term technical context, in which a range-bound backdrop remains, along with the recent strength in US data, which may suggest more rate hikes on the horizon for the Fed.
Judging by equities there appears to be little fear around that at the moment, but if we do see this becoming a larger issue over the next week with the September FOMC rate decision on the calendar for next week, this can quickly change.
The near-term support level of note is around 1885, which bears couldn’t break in August. Below that, another major spot of support from prior resistance appears around 1807, which was the swing low in March. That, of course, is when hope came back into US equities that a crisis in regional banks would compel the Fed to take a step back from rate hikes.
And here we are six months later, still talking about rate hikes given continued strength in US data. If we see markets pricing in a greater probability of more hawkishness from the Fed we could see that 1807 level come back.
Gold (XAU/USD) Weekly Price Chart
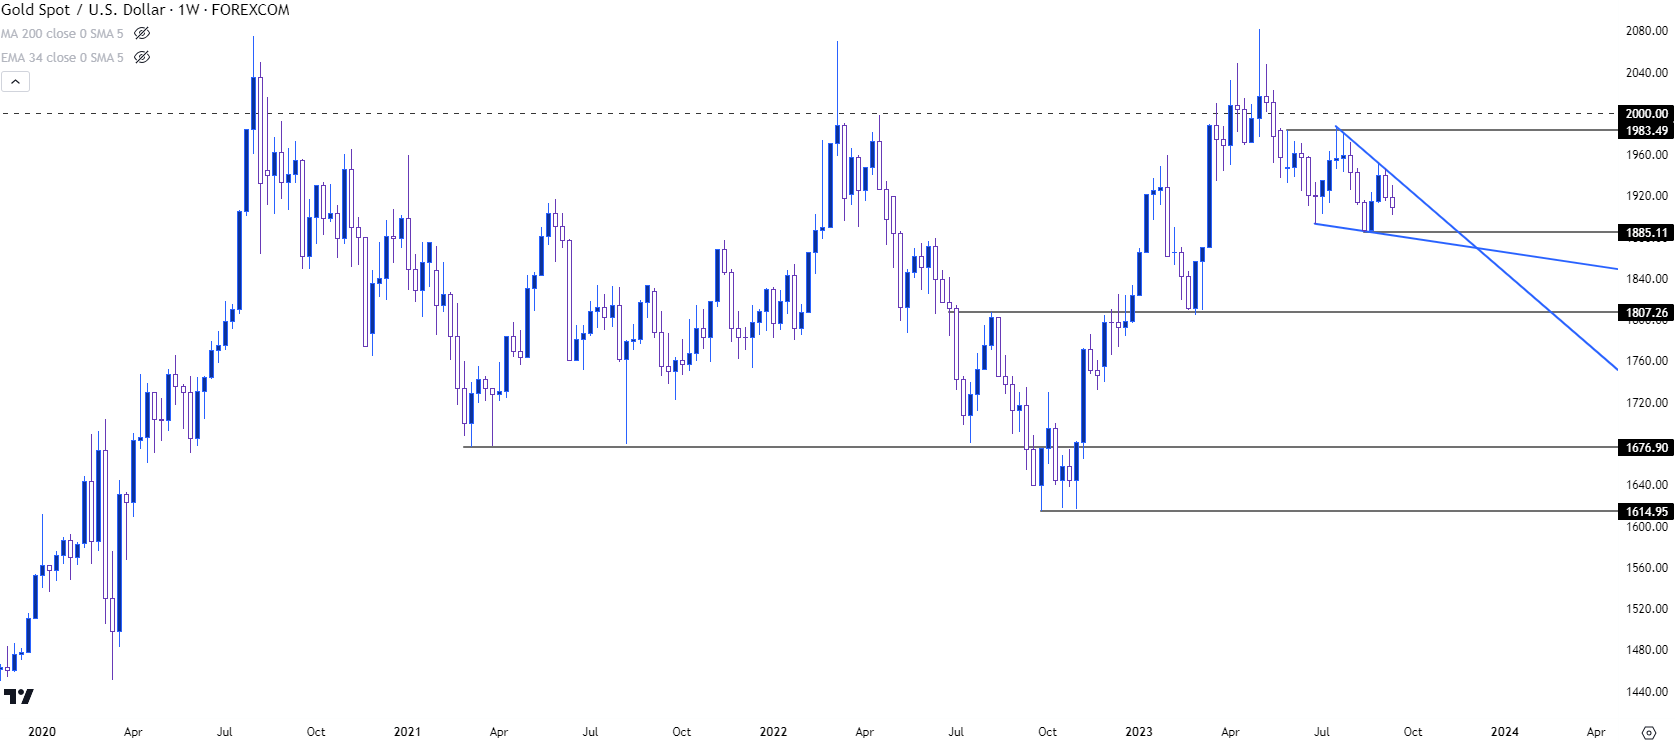 Chart prepared by James Stanley, Gold on Tradingview
--- written by James Stanley, Senior Strategist
Latest market news
Yesterday 01:32 PM
Yesterday 09:35 AM
Yesterday 07:23 AM
Yesterday 04:48 AM
Yesterday 12:17 AM
July 25, 2024 10:39 PM
Latest Trade Ideas articles

Yesterday 09:35 AM

Yesterday 12:17 AM

July 25, 2024 10:39 PM

July 25, 2024 05:30 PM