


USD, EUR/USD, USD/JPY, Gold Talking Points:
- The next couple of days bring high-impact events on the economic calendar with tomorrow’s release of US CPI figures followed by Thursday morning’s ECB rate decision.
- Next week brings the FOMC rate decision so the potential for volatility will remain even after Thursday. Markets are currently expecting no rate moves at next week’s FOMC meeting but are holding on to a greater than 40% chance of at least one more hike by the end of the year. This would mean that next week’s meeting is where the bank would set the table for such, and this will keep focus on the verbiage and details around that move. But we first get CPI data, and this can bring a strong impact across markets as rates and inflation expectations remain centerstage.
- This is an archived webinar that’s free for all to join. If you would like to join the weekly webinar on Tuesdays at 1PM ET, the following link will allow for registration: Click here to register.
The next two days bring two high-impact items on the economic calendar and that helps to set the stage for the following week, where the FOMC will dominate the headlines even though markets are currently expecting no changes at that meeting. Instead, with a +40% probability of another hike by the end of the year the question will be whether the Fed foresees any additional tightening in 2023. If they do, this could bring a negative push to equities along with continued strength in the USD. If they don’t, we could see that bullish trend in the USD relax as equity bulls would get one more indication that the Fed may, in fact, be done with rate hikes for this cycle. But this would be another one of those rate decisions where the nuance in messaging is the key, as opposed to any overt statements about future policy moves.
Tomorrow’s release of CPI and the European Central Bank rate decision scheduled for the morning after will feed into this argument, particularly in the EUR/USD pair, which has seen its trend flip over the past two months after resistance showed up at a key Fibonacci level at 1.1275.
In the US Dollar, the DXY has found resistance at a familiar spot of 105. This was a level that I had looked at in the webinar last week and it’s also the same swing-high that came into the picture in May of last year, just before the USD bulled its way up to a fresh 30 year high. The 105 level came into play last Wednesday and despite bull’s best efforts, they haven’t been able to leave it behind yet. And this morning sees prices pulling back even further, highlighting support potential at a few different spots of prior resistance. The 104.31 level is of note, as this was a swing high in May that then held resistance for a couple of weeks before a push from bears. It was back in a resistance in late-August and, as yet, hasn’t shown much for support. There’s even a case for support around the 104 handle in DXY, along with 103.70 and 103.45. The previous higher-low was at 103.27 and that came in the morning of NFP on September 1, so that would be the spot that bulls would need to defend to retain the sequencing of higher-highs and higher-lows.
US Dollar - DXY Daily Price Chart (indicative only, not available on Forex.com platforms)
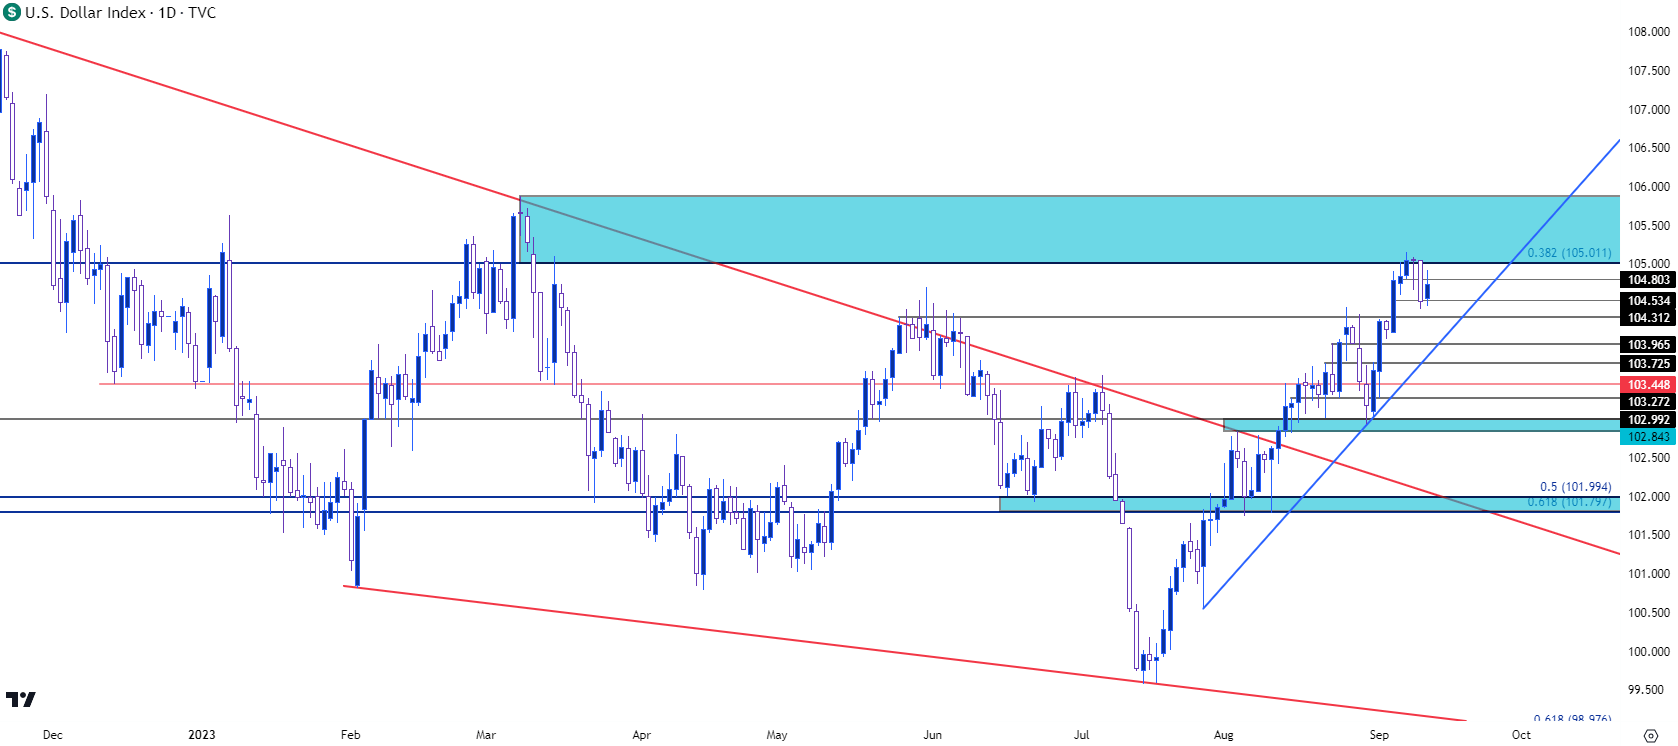 Chart prepared by James Stanley; data derived from Tradingview
USD Longer-Term
Taking a step back to the weekly chart highlights how strong this recent theme has been. Last week marked the 8th consecutive week of USD gains, which would be the most in the currency since a decade prior. This weekly chart also highlights a couple of important areas, including the 105 level that’s currently holding the high. The 102.85-103.00 zone is of note, as well, as this was the spot that caught the lows in late-August, with the 103.27 hit around NFP showing as a higher-low.
US Dollar - DXY Weekly Price Chart (indicative only, not available on Forex.com platforms)
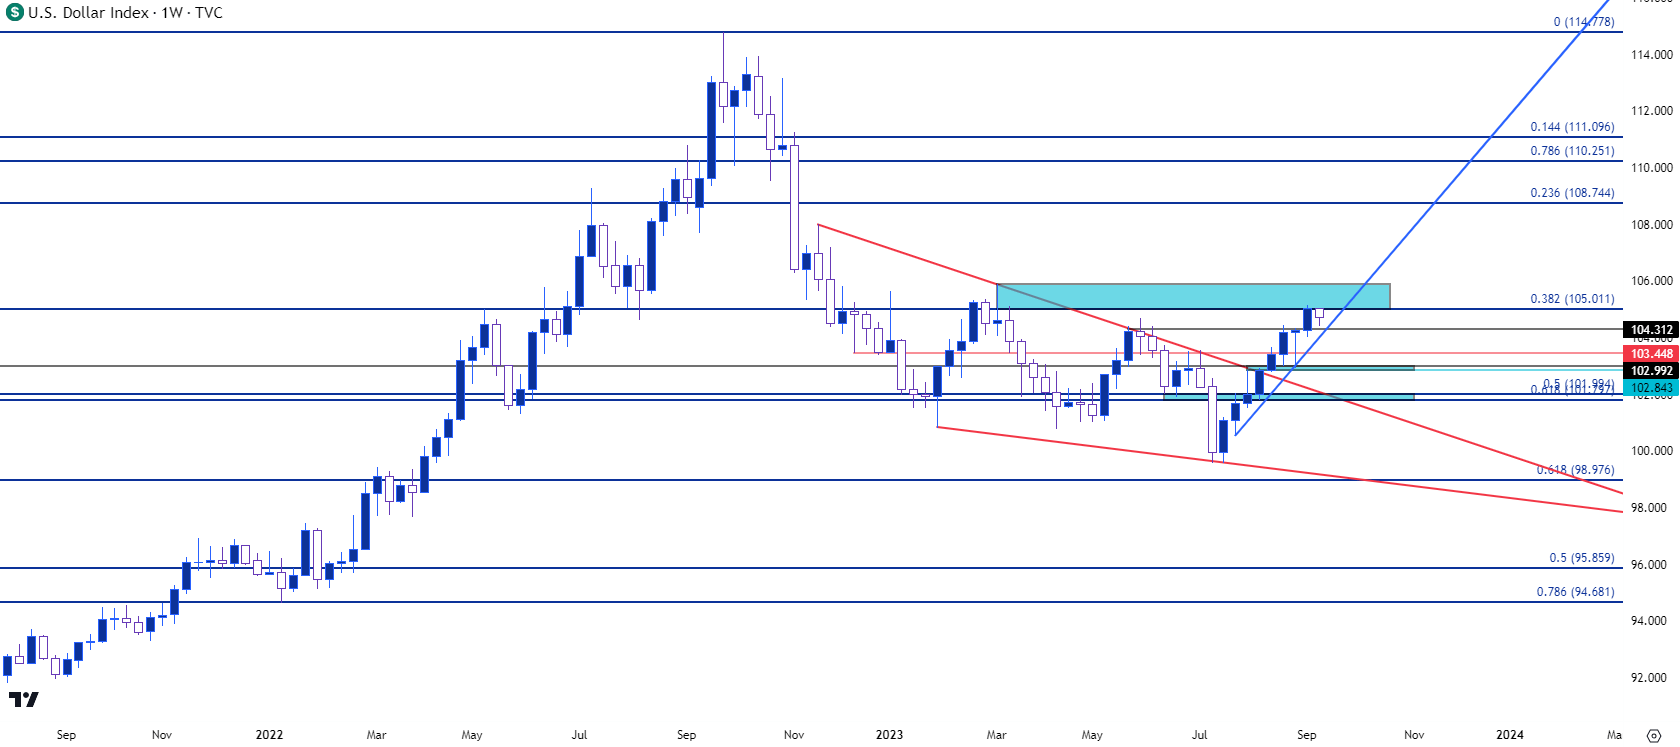 Chart prepared by James Stanley; data derived from Tradingview
EUR/USD
The Euro makes up a whopping 57.6% of the DXY quote so when seeing a move such as we’ve seen in the US Dollar over the past eight weeks, there’s usually some overlap with Euro themes, to some degree. And to be sure, EUR/USD has now sold off for eight consecutive weeks, which would be the first time that’s happened since September of 2014. At the time the pair was just getting started on an aggressive sell-off that would largely run until the next March. As I had written yesterday, for such a popular and widely tracked market to display a trend of that nature is notable, particularly when it’s so rare.
This does bring questions to the Thursday ECB rate decision, however, as the bank no longer issues forward guidance and ECB President, Christine Lagarde, has seemed to avoid the topic of expectations around rates of late. This could keep the door open for one more hike out of the ECB, which I think would catch some by surprise considering the bearish trend that’s been in the pair over the past two months.
As I had outlined yesterday, support remains at 1.0689 and this morning has seen prices push up for a test of lower-high resistance at prior support, from around 1.0760. Shorter-term, this keeps the door open for another possible push up to the 1.0843 level.
EUR/USD Daily Price Chart
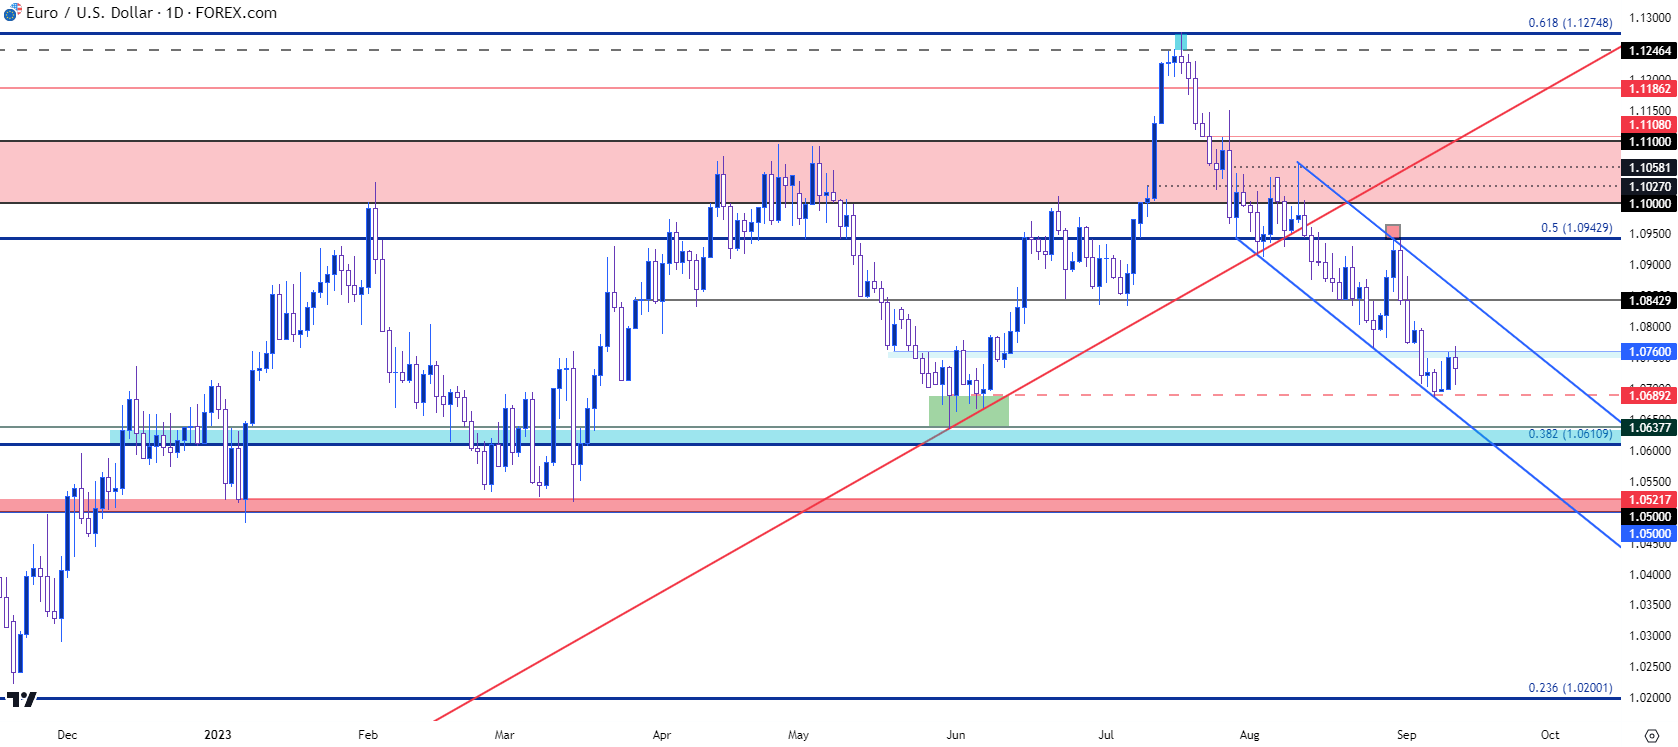 Chart prepared by James Stanley, EUR/USD on Tradingview
Gold (XAU/USD)
Gold is testing a support zone, as of this writing. There was a bullish trend in spot Gold that ran through the end of August trade, eventually allowing for a test of a bearish trendline as produced from the projection from May and July swing highs. Bulls tried to leave that behind in early-September but, so far, have been thwarted.
That trendline hold initially allowed for a pullback to test support at a prior zone of resistance, plotted from around 1925-1932. But bears did away with that, as well, helping to craft a short-term lower-low last week, after which the following bounce again found resistance at the bearish trendline.
That’s allowed for the next lower-low to run into another support test, and this time, it’s the zone between 1903 and 1910 that’s in-play. A hold here could still allow for bullish themes, but if buyers fail to hold price above 1900 then it’s going to begin looking bleaker for bulls.
Gold (XAU/USD) Daily Price Chart
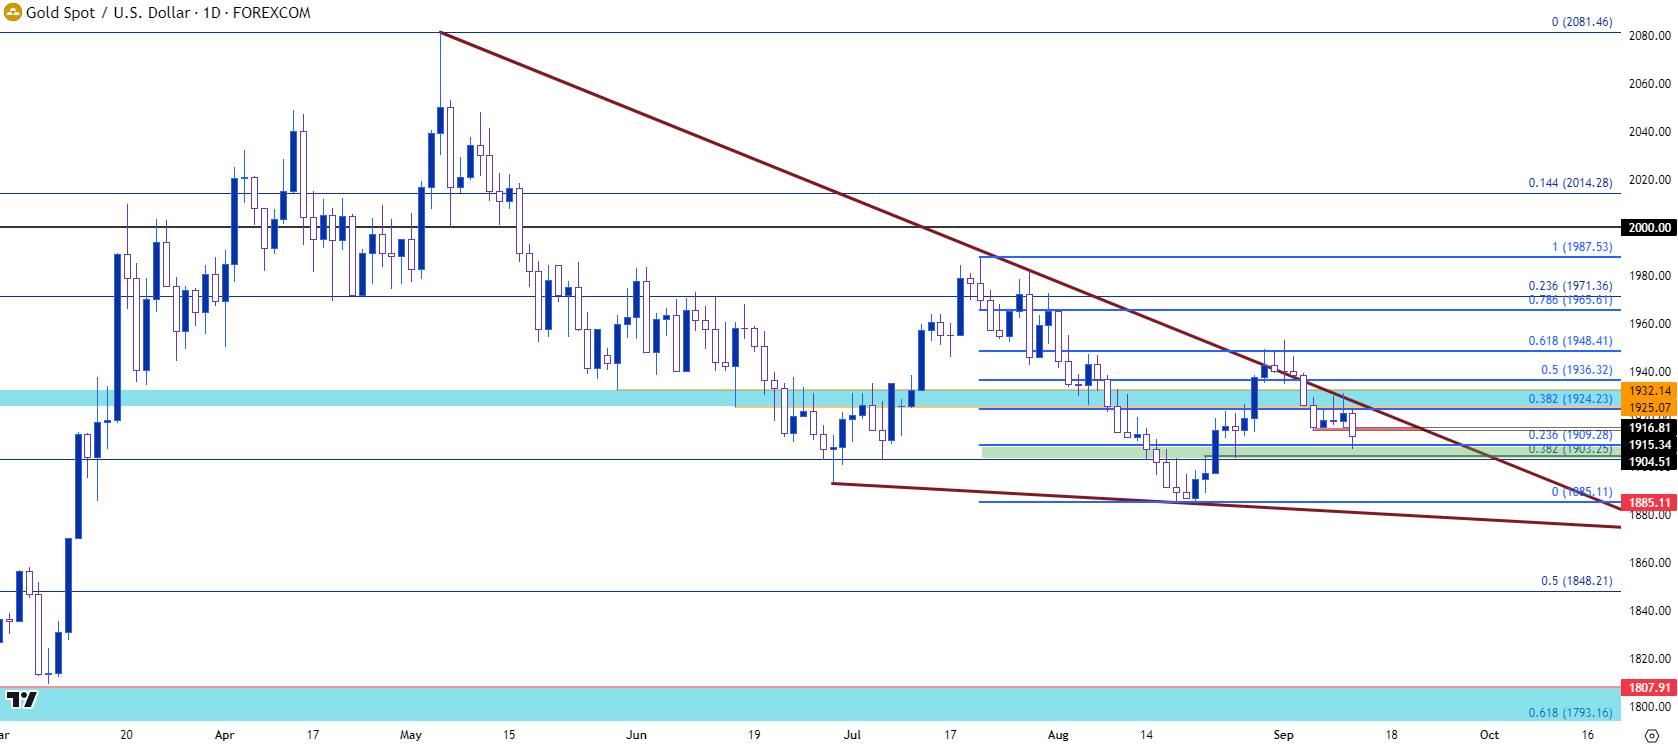 Chart prepared by James Stanley, Gold on Tradingview
USD/JPY
Is the Bank of Japan nearing another intervention?
Judging by price action, we’re not quite there yet, although that moment may be nearing. This links with what I had talked about in the prior week as the pair tiptoes closer and closer to those same levels that brought upon intervention last year.
As shared last week, chasing breakouts could be especially problematic given that risk, and since then we’ve already heard of both intervention threats along with the prospects of a possible rate hike. Now these were just mentions, which is important, but it’s also something that highlights a possible path of turbulence should bulls push for more breakout beyond current resistance at 147.69. The question then becomes for how long that trend might run without another intervention threat.
Support structure has remained intact. The late-week warning of intervention merely brought a pullback to support at 146.65, the same level I had looked at last week. And there’s remaining support potential around the 145 level and, perhaps even as deep as 143.89.
USD/JPY Daily Price Chart
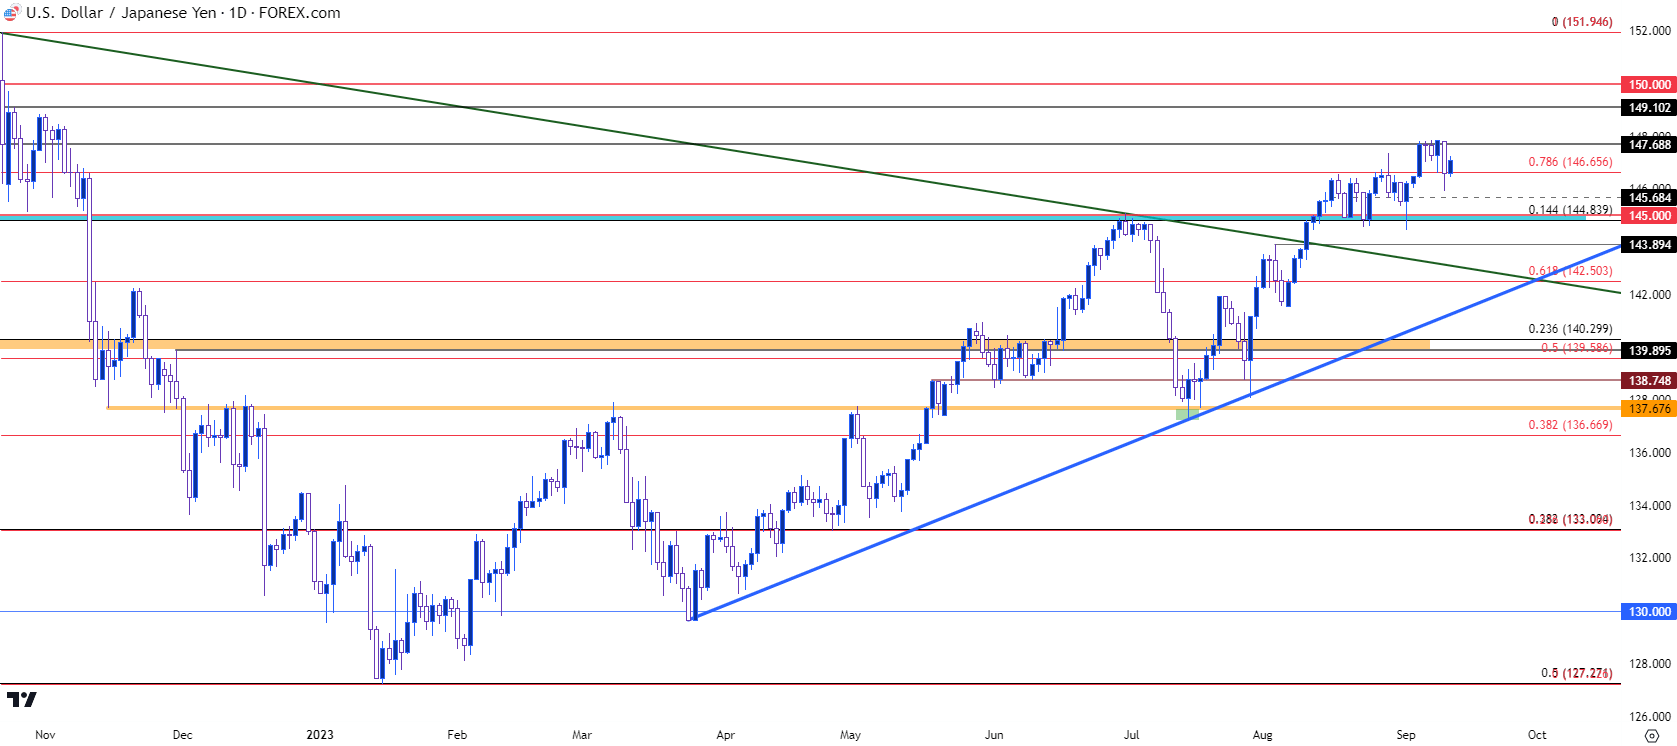 Chart prepared by James Stanley, USD/JPY on Tradingview
--- written by James Stanley, Senior Strategist
Latest market news
Yesterday 01:32 PM
Yesterday 09:35 AM
Yesterday 07:23 AM
Yesterday 04:48 AM
Yesterday 12:17 AM
July 25, 2024 10:39 PM
Latest Trade Ideas articles

Yesterday 09:35 AM

Yesterday 12:17 AM

July 25, 2024 10:39 PM

July 25, 2024 05:30 PM