us steals the show 2681932016
Team Trump appointments The bond market rout Look ahead indices Look ahead FX Look ahead commodities Asia Stock Pick of the Week Throughout the week […]


Team Trump appointments The bond market rout Look ahead indices Look ahead FX Look ahead commodities Asia Stock Pick of the Week Throughout the week […]
Throughout the week the markets have stayed centered on what a Trump Presidency could mean. Still with very little substance to go on, the results have been impressive; the Dow Jones has hit new record highs, whilst the US dollar has gone from strength to strength.
In his first live interview as president elect, Trump came across as much more Presidential than at any point during the campaign trail and appeared to back away from some of his more extreme rhetoric – for example we are now only expecting a fence, in some parts, between Mexico and the US as opposed to a wall spanning the entire boarder.
The pivotal take away points so far are the plans for the biggest tax reform in 30 years and a planned infrastructure spending spree to the tune of $1 trillion. The reflationary nature of the policies and plans that Trump’s administration looks set to put in place have played havoc with the bond market and sent the US dollar to 13 year highs versus a basket of currencies. So, will these trends continue into next week?
This week saw Trump begin to build Team Trump. Early appointments have pointed towards a surprisingly balanced approach from Trump ,with his chief of staff choice showing signs of moving closer towards Republican mainstream in the form of Reince Priebus, balanced out by an ultra-right chief strategist Stephen Bannon. So far the choices are providing tonic to the markets however given that Trump is rather unorthodox we could still expect some surprises next week as more names are mentioned.
Perhaps the most damage could come from any signs going forward that Trump is looking to bring in key players that may be intent on curbing the Federal Reserve’s authority. This would put a shiver through the Fed and a chill in the markets, encouraging flight into safe-haven assets.
The global bond market has been one of the most serious casualties emerging from a Trump triumph. Although Trump has been showing a slightly softer side with regards to some of his policies, the overall message so far is that Donald Trump’s policies will stimulate growth and inflation.
Debt prices have fallen sharply again for much of the week, although they are showing signs of slowing. As a result, 10-year Treasury yields hit 2.2%, the highest level so far this year and up sharply from its all-time closing low of 1.36% in July; shorter dated debt such as the 2-year note hit its weakest level since the start of 2016.
We are seeing strong signs that Investors are relocating out of low yielding bonds and into stocks, which look set to prosper, possibly marking the beginning end of the 30-year bull run in bonds. The bond rout is expected to continue into next week and beyond, however, we may well see the pace of the sell-off steady.
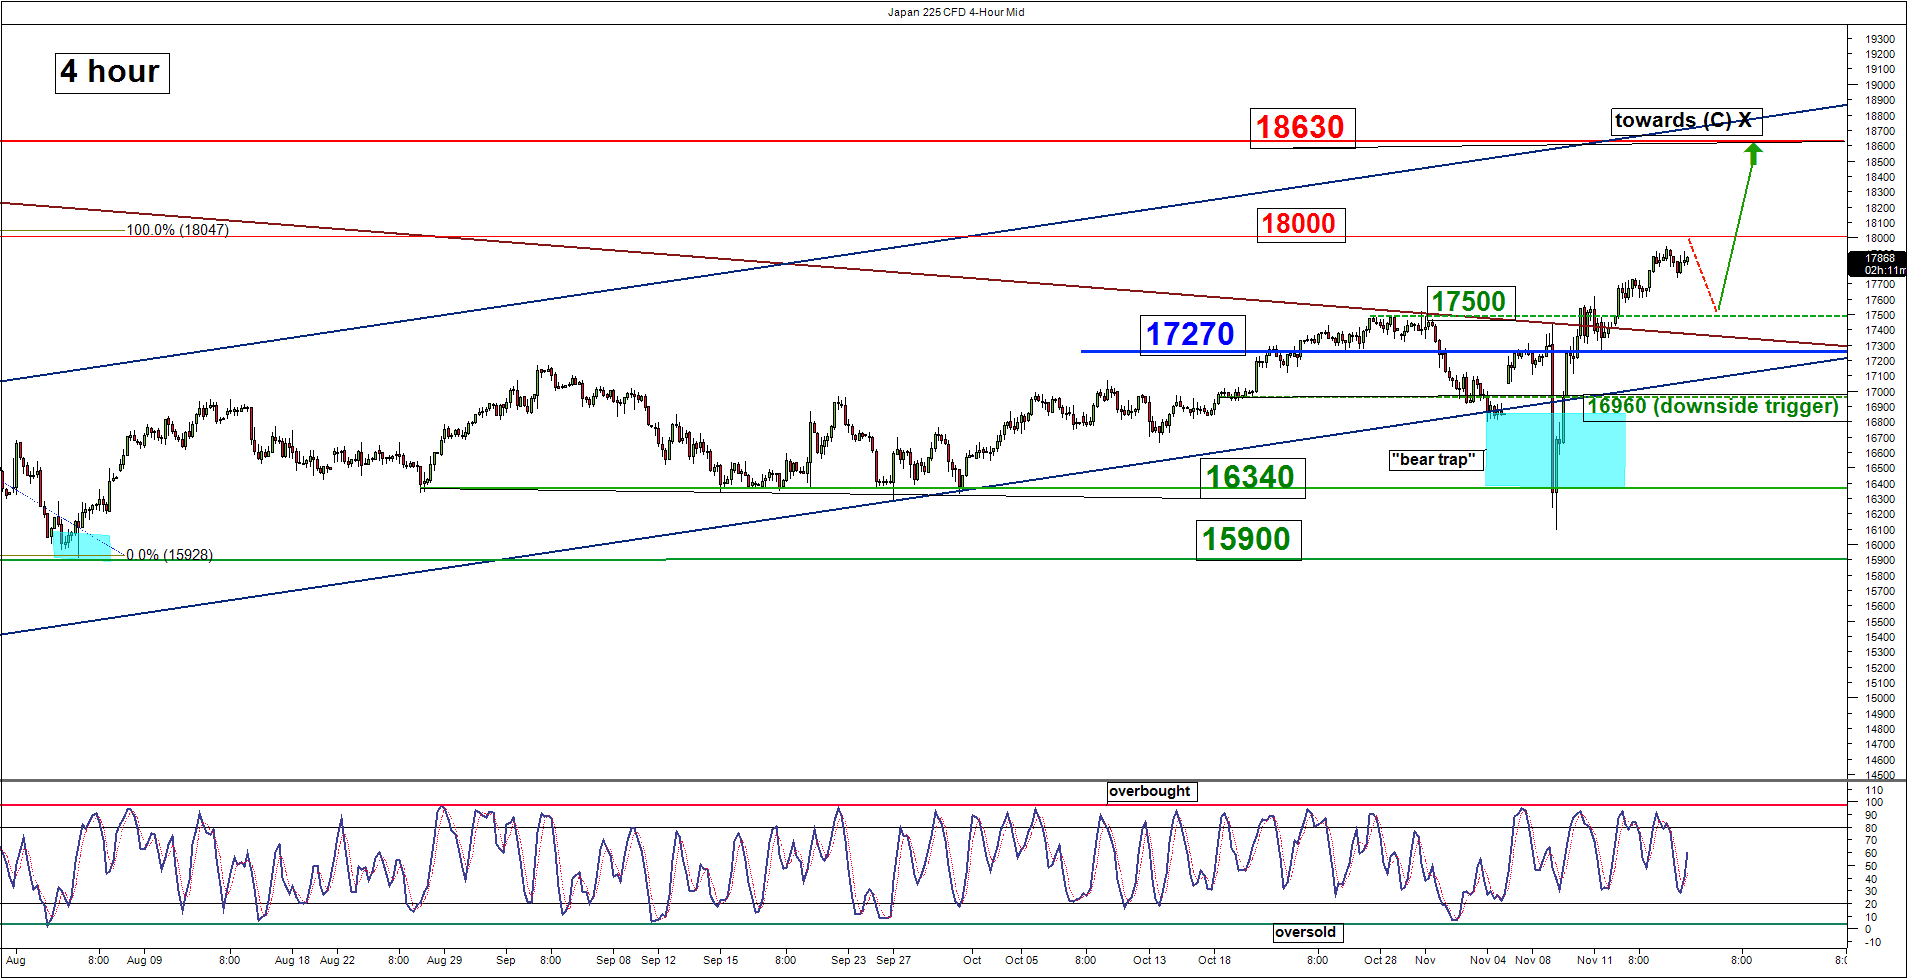
Nikkei 225 – pull-back first before further potential upside
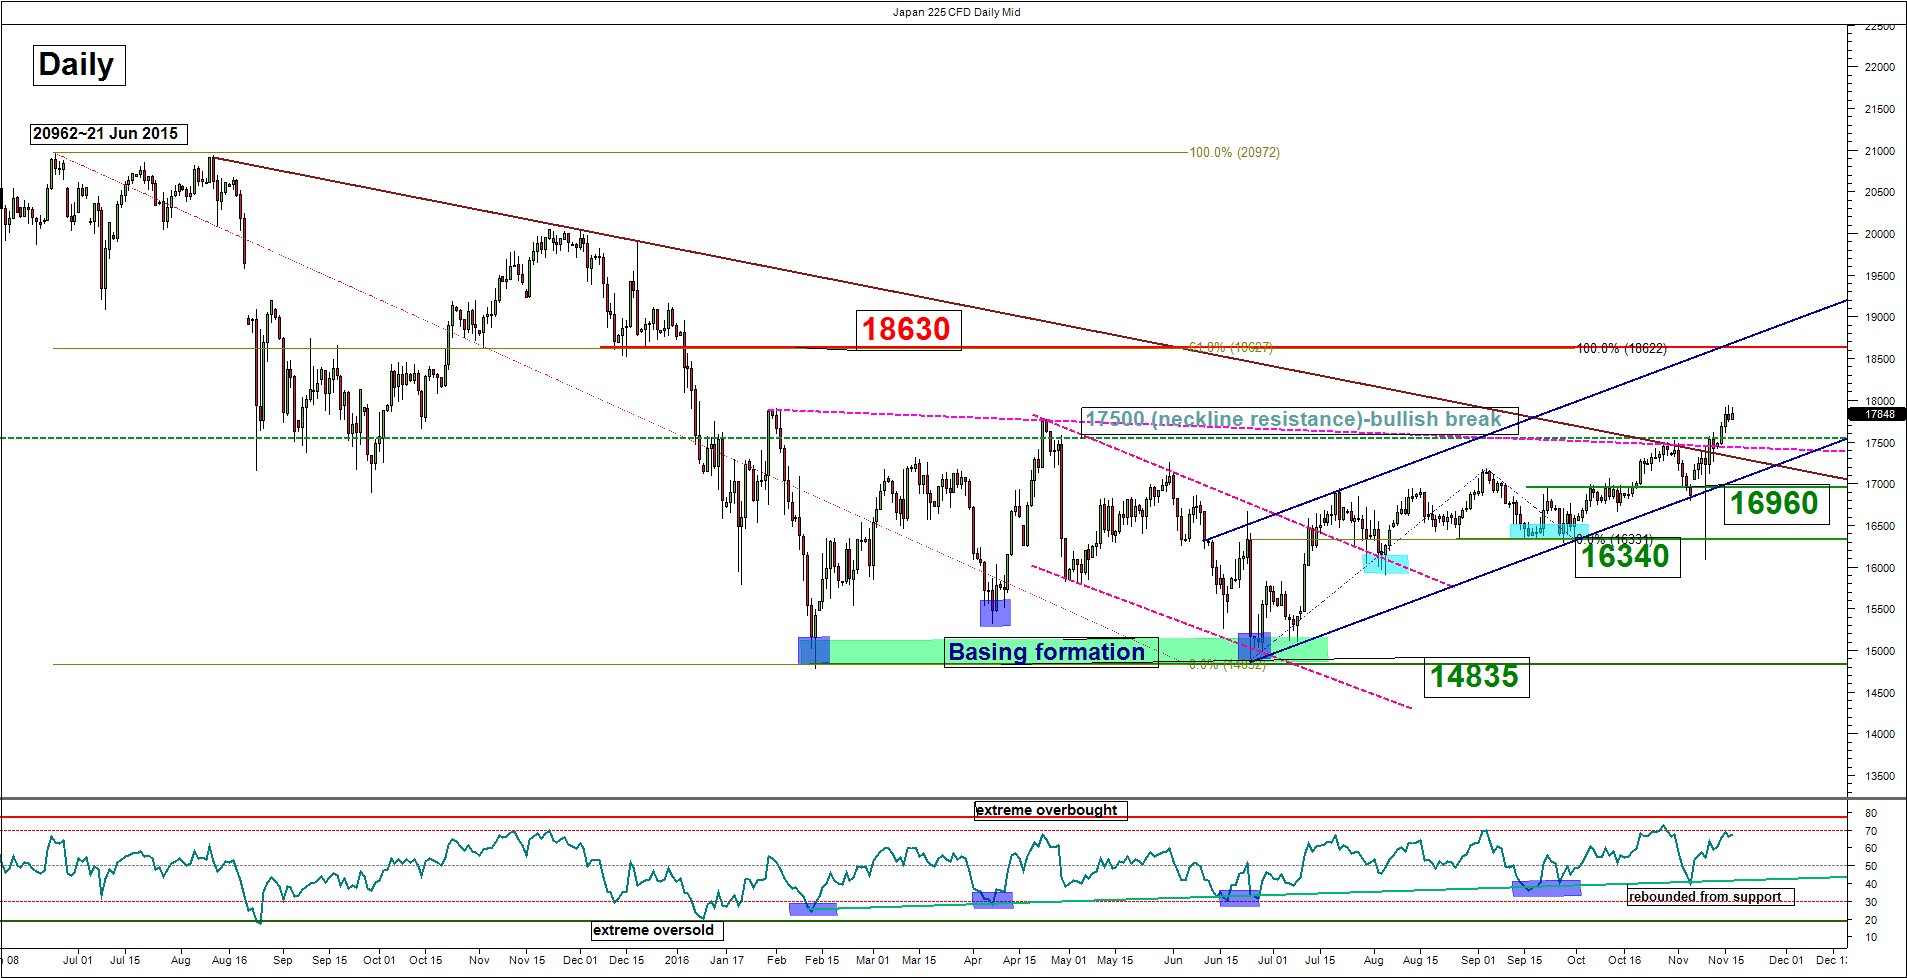
Key Levels (1 to 3 weeks)
Intermediate support: 17500
Pivot (key support): 17270
Resistances: 18000 & 18630
Next support: 16960 (downside trigger), 16340 & 15900
Medium-term (1 to 3 weeks) Outlook
The Japan 225 Index (proxy for the Nikkei 225 futures) has managed to stage the expected push up post U.S. presidential election and rallied by 11.5% to print a high of 17943 on 16 November 2016. This current up move came close to our first expected medium-term upside target/resistance at 18000.
U.S. president-elect Donald Trump had pledged to repeal the Trans Pacific Partnership (TPP) in his anti-trade campaign pledges which will cause a negative impact on Japan’s economic growth prospects. However, the Nikkei 225 has ignored the TPP issue and staged a rally largely driven by a strong USD/JPY. Over a longer-term horizon (3 to 6 months), we reckon that the current up move seen in the Nikkei 225 is not sustainable due to the uncertainty that surrounds in Donald Trump’s trade policies stance. However in the medium-term (1 to 3 weeks), the positive feedback loop seen in the USD/JPY remains intact from a technical analysis perspective and it should support a further potential upside movement in the Nikkei 225.
Technical elements seen in the Index remains positive as well after the recent bullish breakout from its former long-term descending trendline resistance from 21 June 2015 high. Below 18000, the Index may see a pull-back first towards the 17500 pull-back support of the former long-term descending trendline resistance (depicted in brown) with a maximum limit set at the 17270 medium-term pivotal support before another potential upleg materialises to target the next resistance at 18630 (also the upper boundary of a medium-term ascending channel in place since 24 June 2016 low -Brexit).
However, a break below 17270 pivotal support is likely to but the bulls on hold for a retest on the 16960 ascending channel support. Only a clear break below 16960 (a daily close below it) shall open up scope for a further decline towards the next support at 16340.
Charts are from City Index Advantage TraderPro as at Thurs, 17 Nov 2016
With the Autumn statement next week sterling is once again in focus. The pound was under pressure against the dollar at the beginning of the week, selling off from above $1.2570 to $1.2380 as weak inflation data weighed on sentiment. This is the level that the pound is looking to close the week on; there were some positives worth mentioning, such as strong retail sales numbers, which provided a lift to the pound pushing it above the $1.25 handle, but ultimately this was short lived as dollar strength stole show as the dollar charges full steam ahead to an expected rate rise in December. Looking forward to next week, sterling will be bracing itself for the Autumn Statement, any positive outlook rhetoric from Hammond will potentially send sterling higher, as will any focus on fiscal stimulus.
Focusing on technicals, should sterling fall below $1.2365, its 20-day moving average – this will reaffirm the short term downward trend channel and send the currency towards $1.23 before testing support at $1.2240. On the upside a 1.2440 is presenting itself as the next hurdle before attempts to reclaim the $1.25 level.
The US dollar has continued to go from strength to strength as inflationary policies from Trump are putting rate rises firmly back on the map for 2017. The market is currently pricing in almost a 100% probability of a rate rise in December, with gradual hikes expected throughout 2017 and 2018 which the market is looking to Janet Yellen for confirmation of as she speaks to Congress this afternoon. The US dollar index is currently hovering at 18 month highs and will look to Janet Yellen’s outlook for the coming year as to whether it will look to break higher.
The market appears almost certain that a US rate will be forthcoming next month: according to the CME’s FedWatch tool, a December rate hike is around 90% likely now. That view has been supported by hawkish comments from the Fed’s Janet Yellen and mostly stronger-than-expected US data this week. While the dollar rally could extend far beyond anyone’s imaginations one has to consider the possibility that a rate rise is priced in now. If so, the dollar could at the very least pause for breath. However, it is not just about December. The market will want to know what will happen afterwards. Looking around, nearly all other major central banks are still dovish, not least the Bank of Japan.
The latter announced that it would be snapping up an unlimited amount of five-year and two-year bonds at fixed rates in the wake of the global bond market sell-off. The Japanese central bank is keen to cap the 10-year yield at or around zero. Thus, the BoJ remains pretty much dovish as the Fed grows more hawkish by the day. Given this growing disparity between monetary policies of the US and Japan, the USD/JPY remains fundamentally supported. However in the short-term, the prospects of profit-taking could limit the upside for this popular pair, especially when you consider the fact that the Dollar Index has reached its own key 100.00-100.50 resistance range.
Still, our long-term outlook on the USD/JPY remains bullish. We have been banging on about the prospects of a rally in USD/JPY from around 100, even before it dropped to test that key long-term support and psychologically-important level in the summer. Our bullish bias was confirmed when it broke above a bearish trend line at the start of October, when its faster moving 21-day exponential moving average also crossed above the now-rising 50-day simple moving average. The gap between these moving averages have since been expanding, which is bullish. In another bullish development, the 200-day SMA was also taken out as price made its second distinct higher high, having already created several higher lows. So you get the picture: the trend is technically bullish. This means, expect the dips to be bought as the path of least resistance is to the upside.
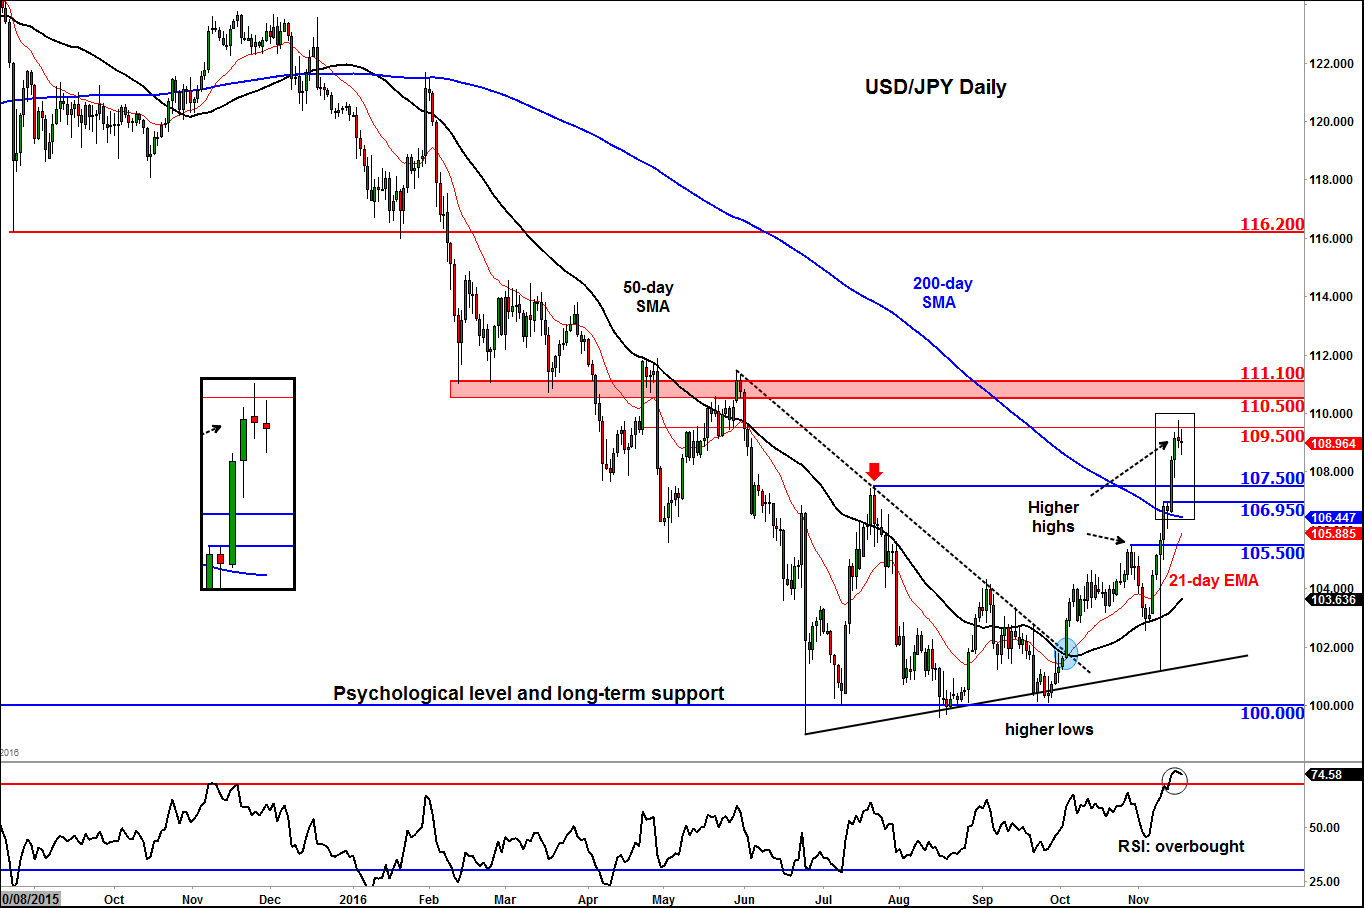
Source: eSignal and City Index
After having successfully defended the 0.7720-7770 resistance range once again earlier last week, the sellers managed to push the AUD/USD through the 50-day moving average and the rising trend line on Friday. In the process, several short-term support levels were taken out, including the 0.7580 level. At the start of this week, the AUD/USD paused for breath, but the selling pressure resumed again as we approached the end of the week. As a result, the 200-day moving average has also been taken out. So the trend appears to be firmly bearish now and it looks like price has also formed a double top reversal formation.
If the break below the 200-day average is sustained now, we could see price test the prior swing low at 0.7445, which is also the neckline of the double top formation. In theory, if that level also breaks down then we could see an eventual drop to 0.7145, which was a major low in the summer and corresponds with the measured move objective of the double top pattern. That being said, a potential break back above short-term resistance at 0.7580 would invalidate this bearish outlook. In this scenario, a short-squeeze rally towards 0.7630 or even 0.7720 would then not come as a surprise.
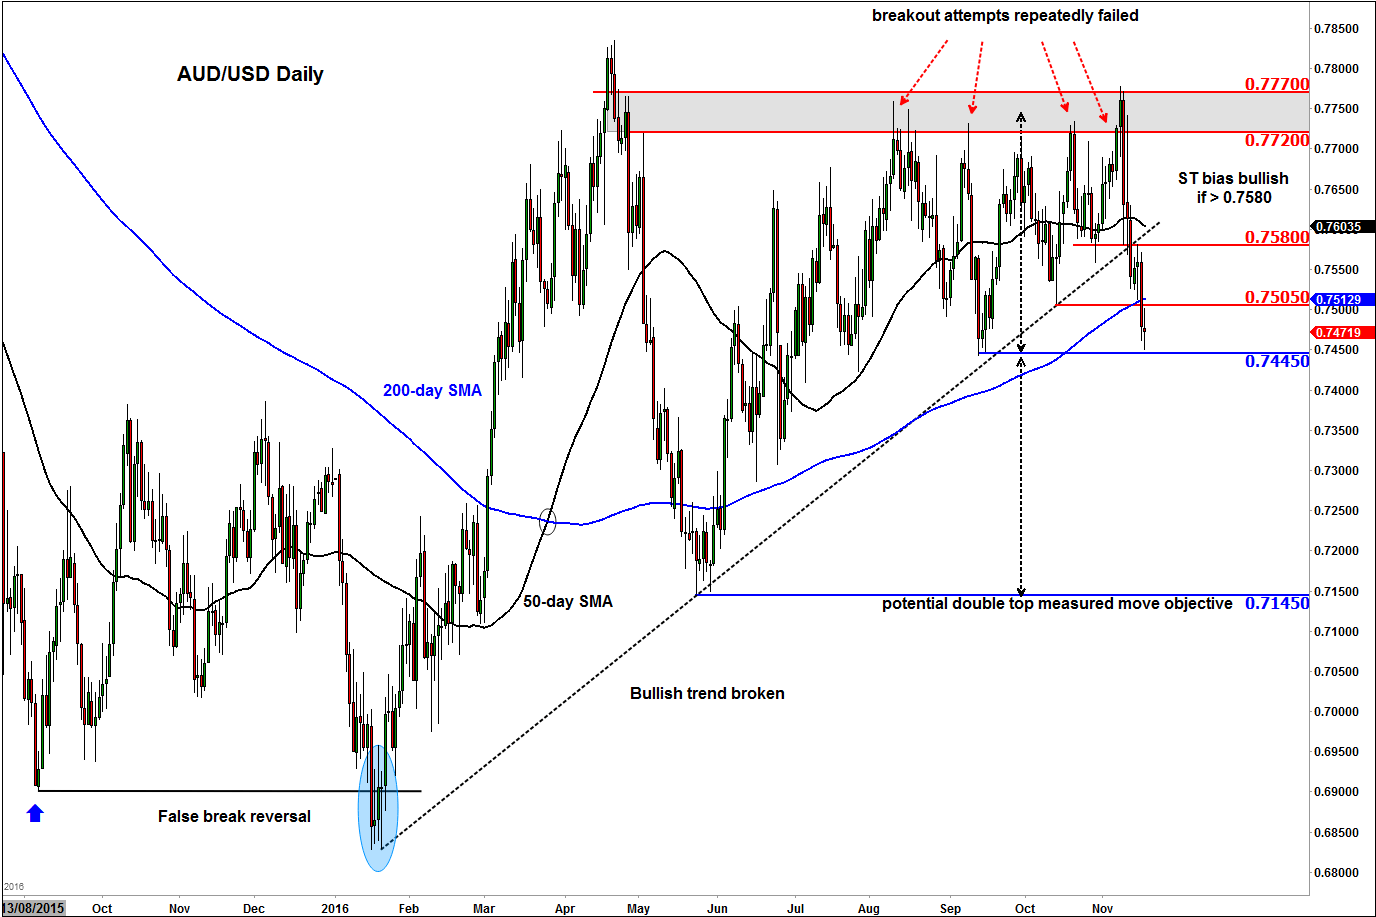
Source: eSignal and City Index
US oil has had a rocky ride this week, swinging from positive to negative territory on production cut rhetoric and stockpile data disappointment as we head towards the OPEC meeting at the end of the month. At the time of writing US oil is up 2.9% week on week but down 8.9% month on month. Once again in the lead up to this meeting, in what is almost a tradition now, there has been plenty of rhetoric regarding a potential cut in oil production amid a global supply glut. Tuesday saw oil jump 6% on hopes of a cut, only to retrace some of the gains following disappointing stockpile data. By the end of the week hopes were once again high of a deal being reached and any news flow going forward will continue to drive the price action.
Inventory data this week was significantly greater than expected with US stockpiles coming in at 5.07 million barrels versus an expectation of 1.8 million barrels. Volatility in the crude oil market is expected to remain with us as we head into next week. Any further significant stockpile increases may compel OPEC to come to an agreement on November 30th, in which case we would expect to see US crude break comfortably above $50 the barrel.
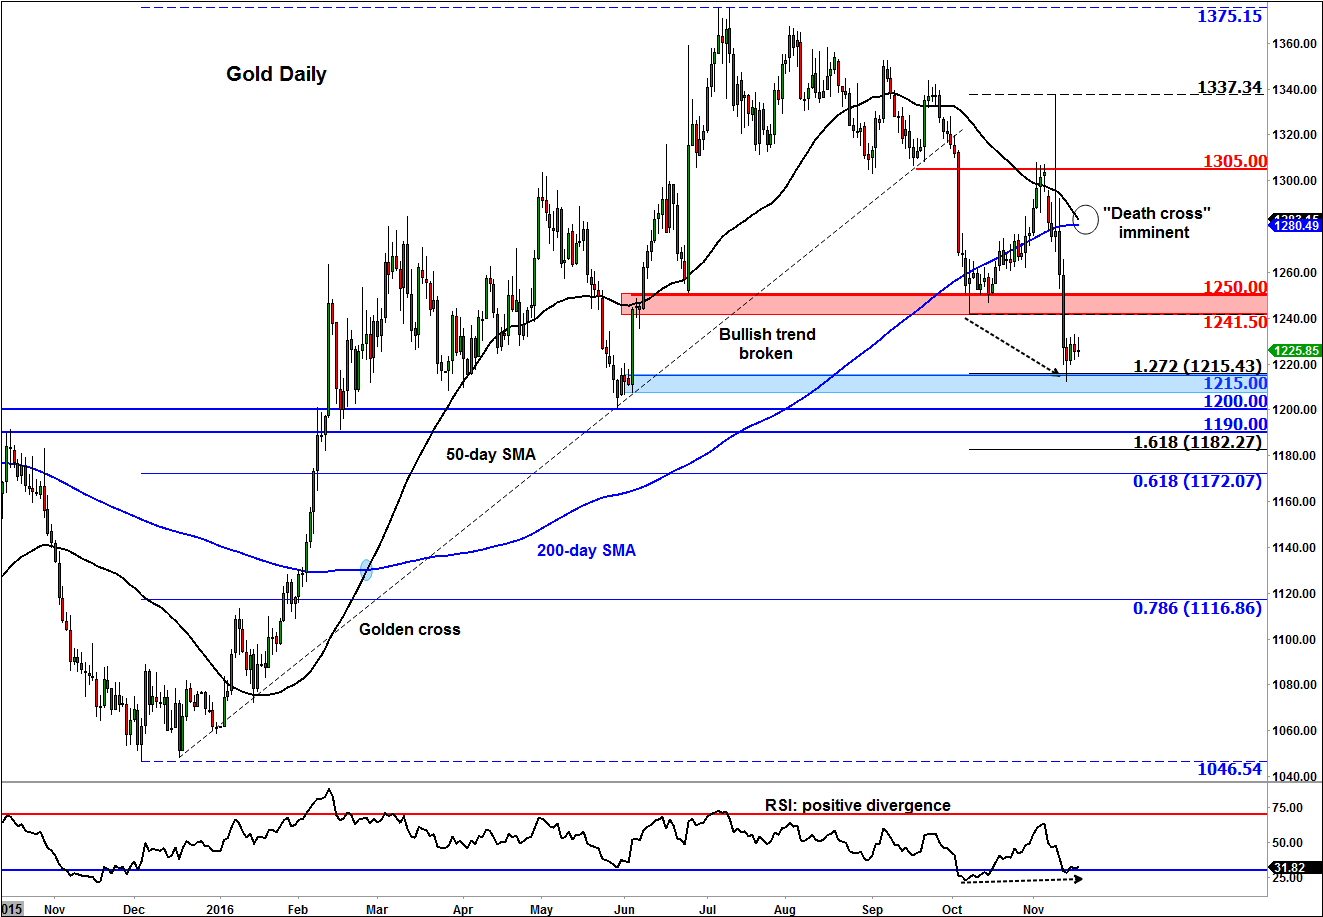
The dollar-denominated and perceived safe-haven gold’s big plunge has been in response to both an appreciating US dollar and a sharp improvement in risk appetite as highlighted for example by the rising equity prices. Technically, gold’s failure to stage a more significant bounce from the $1215 support level is bearish as it shows a lack of willingness from the buyers to commit at these levels. This bearish outlook would become weak if gold were to climb back above the prior support area between $1241 and $1250. But even so, the trend would still remain bearish until and unless gold forms a higher high above $1337.
In another bearish development, the 50-day moving average looks set to cross below the 200. When the averages are in this order, some trend followers tend to only focus on selling rather than buying setups. So, the pressure on gold may increase from this group of speculators. Thus, the path of least resistance remains to the downside for now, even if we see short-term bounces. The next level of support below $1215 is the psychologically-important $1200 mar, although a more significant support level is at $1190 which was formerly resistance. Given the technical damage, we reckon that gold could eventually fall much lower than these levels before we see a bottom.
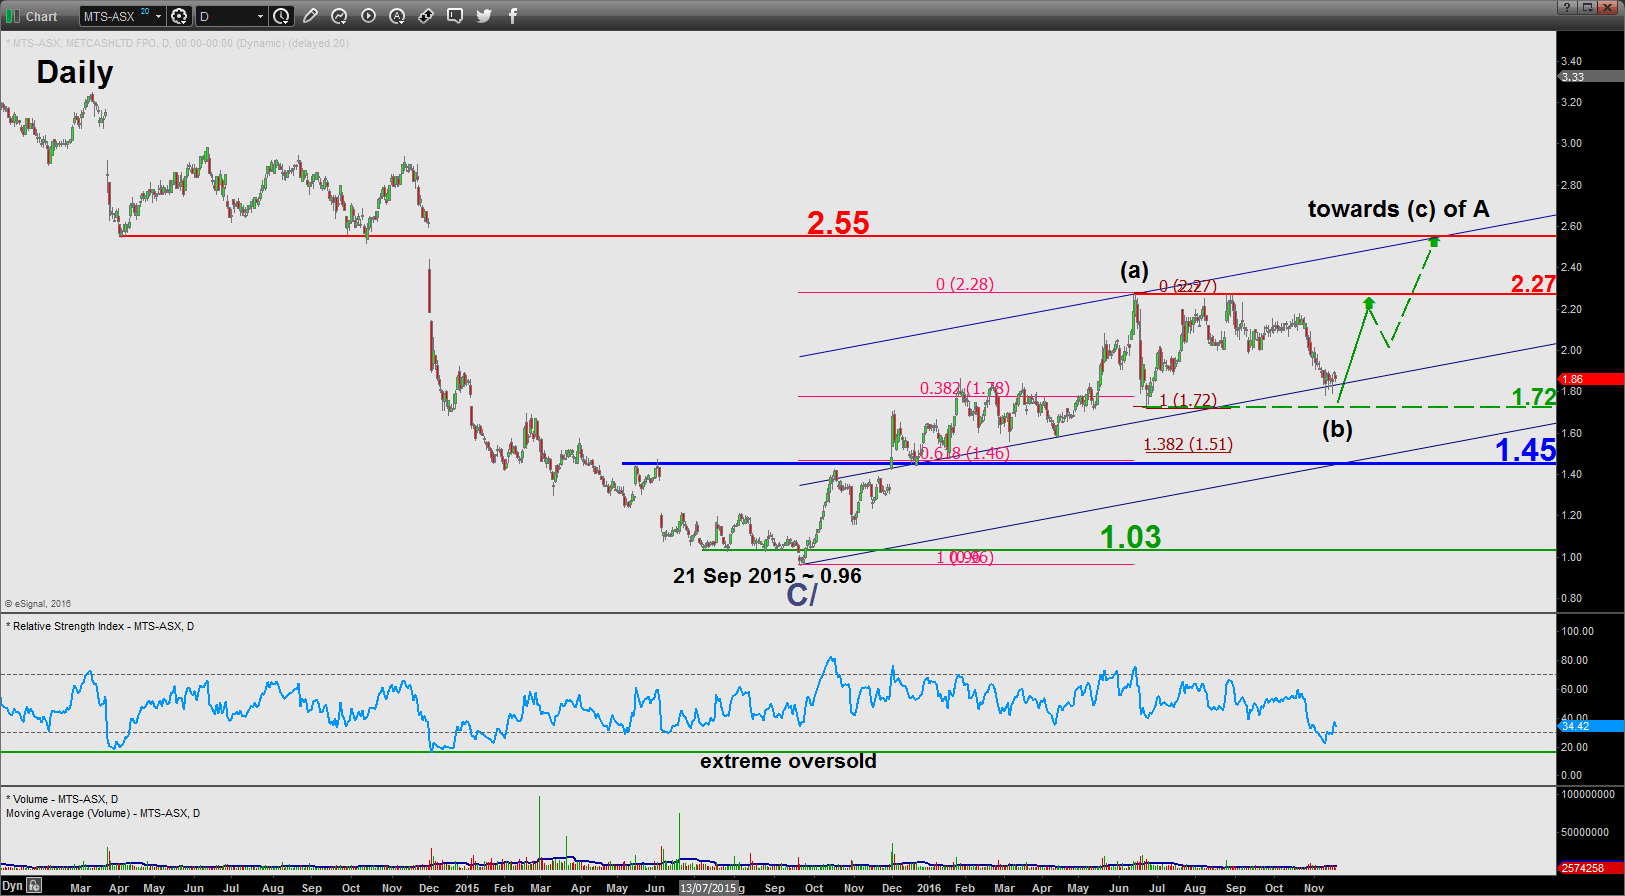
Metcash Limited, an Australian wholesaler and distributor that is engaged in supplying and supporting approximately 10,000 independent retailers and over 90,000 other business across the food, grocery, liquor and hardware industries has seen its share price staged a remarkable rally of 139% from a low of 0.96 printed on 21 September 2015 to record a recent high of 2.27 seen on 29 August 2016.
The current turnaround on its share price came after a primary bearish trend that lasted for 8 years that saw it plummeted by 80% from its current all-time high of 5.40 printed on 23 April 2007. The recent rally has also been aided by its home improvement business segment where it complete the acquisition of Woolsworths Limited’s home improvement business (Home Timber & Hardware Group).
With its interim FY 2017 earnings announcement that is scheduled to be release on 28 November 2016, can Metcash sustain its on-going medium-term upside movement in place since 21 September 2015 low of 0.96? Let’s us decipher it from a technical analysis perspective.
Metcash Limited (ASX: MTS) – Potential recovery above 1.72/1.45
Key elements
• The recent 22% decline seen from the August 2016 high of 2.27 is now coming at/close to a significant support of 1.72 which is defined by a confluence of elements. Firstly, it is the median line of a medium-term ascending channel in place since 21 September 2015. Secondly, a Fibonacci cluster. Thirdly, a graphical congestion area from 25 January 2016 to 23 June 2016.
• The daily RSI oscillator is now coming close to an extreme oversold level which indicates that the downside momentum of the current down move is being overstretched where a potential bullish reversal is imminent.
• The lower boundary of the medium-term ascending channel is at 1.45 which is also defined by a Fibonacci cluster.
• The upper boundary of the medium-term ascending channel stands at 2.55 which also coincides with the former support of 03 April 2014 to 13 October 2014 and the gapped down seen on 02 December 2014.
Technical elements are now advocating for a potential recovery. As long as the 1.45 medium-term pivotal support holds, Metcash is likely to see a potential up move to retest the June/August 2016 range top at 2.27 before targeting 2.55 next.
However, failure to hold above the 1.45 pivotal support may invalidate the preferred bullish bias for a continuation of the down move towards the major swing low area of 1.03 seen on late September 2015.
Chart is from eSignal as at Thurs, 17 Nov 2016