


The Australian dollar handed back all of its pre-RBA gains, which was trying to notch up a fifth consecutive bullish day on anticipation of a more hawkish RBA. Yet the statement was not overly hawkish and Governor Bullock said the RBA “believe rates are at the right level to get inflation back to target”. Inflation was revised higher to show inflation falling back to target at a slower pace and the RBA remain “vigilant” to upside risks.
Ultimately, the Fed closing the door on further hikes has provide the RBA more wriggle room to see if a 4.35% cash rate can finally work its magic. There are signs of strain in the economy, but not enough to cut rates whilst there’s also no immediate threat of a hike. My view remains unchanged that a 4.35% cash rate is likely to remain in place this year.
The US dollar retraced higher for a second day although it doesn’t have the hallmarks of something that wants to return to ‘bull’ status soon, especially if the Fed continue to drop dovish cues.
Gold could appeal to bulls for a potential long setup after prices retraced lower against Monday’s bullish range expansion day. $2300 seem to be a level of importance, so ideally prices can hold above that level for a move towards the highs near $2350.
AUD/USD technical analysis:
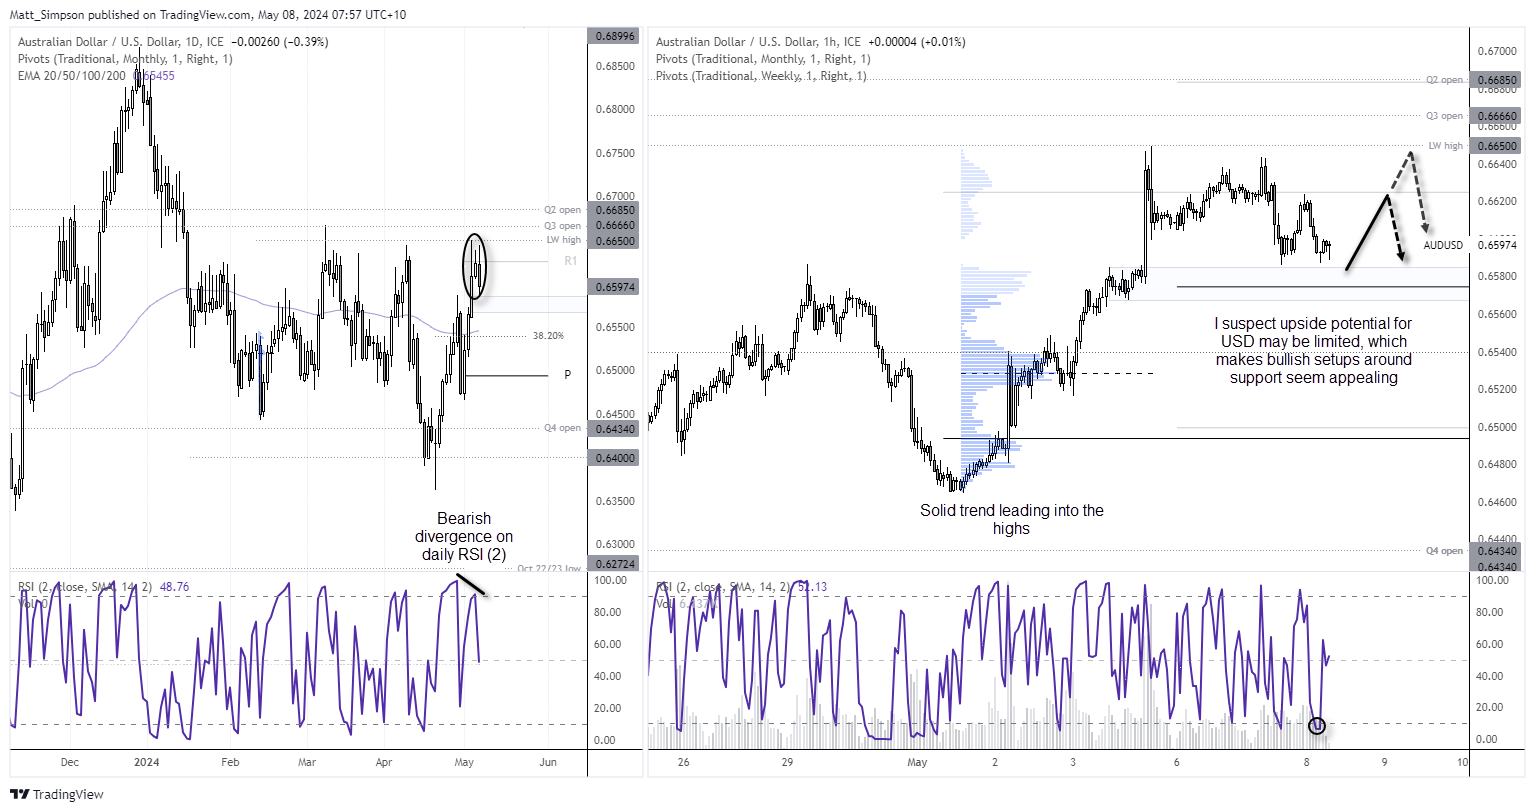
A bearish outside / engulfing day formed on AUD/USD to show a reluctance to retest the Q3 open, or last week’s high of 0.6650 for that matter. But does that mean it can simply roll over? That is likely down to the US dollar which notched up its second bullish day. And I suspect there is a little more upside potential for the dollar as it retraces against the ‘dovish’ Fed moves, but at the same time dollar strength could also be limited. And that suggest potential support for AUD/USD and choppy trade in the top third of its recent rally.
The 1-hour chart shows a strong bullish trend into the highs and a likely correction / sideways consolidation. RSI (2) reached oversold during US trade, and prices are holding above the weekly pivot point at 0.6575, near a high-volume node and prior consolidation area. Any dips towards the 0.6570-80 may be appealing to bulls who want to trade the range to the long side, although I’m not expecting it to simply break to new highs from here given the levels of resistance overhead.
Economic events (times in AEST)
Unless some unexpected happens, we could be in for a quiet day’s trade. US stockpiles could give a bump for crude oil prices, which are stuck between December’s bullish trendline and the 200-day average and $80 handle. We then have three Fed speakers, who if provide further dovish cues might help send the US dollar low against its 2-day mild rebound.
- 12:30 – RBA chart pack release
- 13:35 – 10-year JGB auction
- 16:00 – German industrial production
- 00:00 – US wholesale inventories
- 00:30 – US crude oil inventories
- 01:00 – Fed Governor Jefferson speaks
- 01:45 – Fed Collings speaks
- 03:30 – Fed Governor Cook speaks
ASX 200 at a glance:
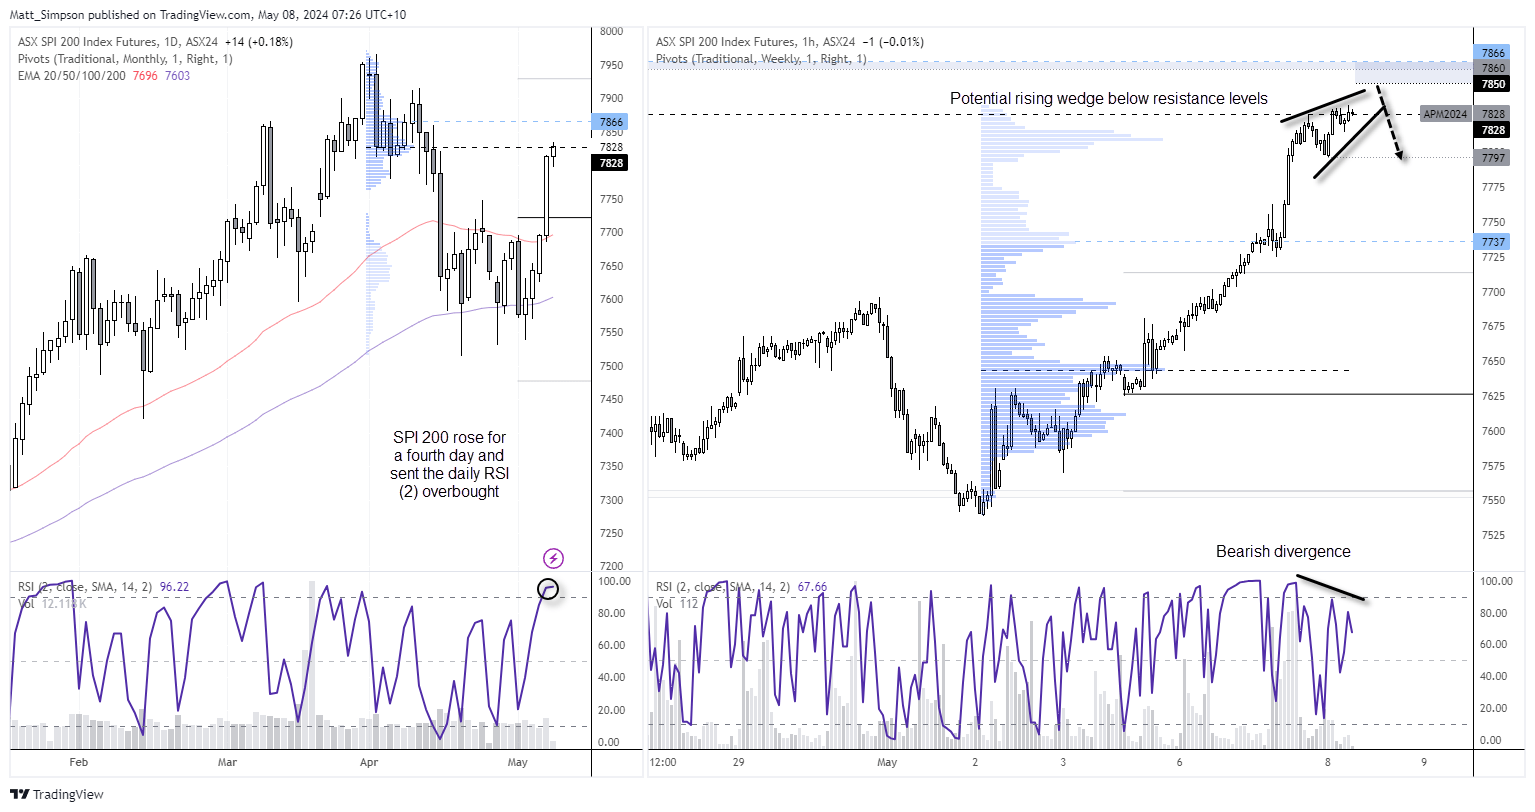
- Positive sentiment and a less-hawkish-than-expected RBA helped the ASX 200 rise for a fourth day
- The ASX 200 cash index has opened at the low of the day on each occasion and within its most bullish week of the year
- Yet price action on SPI 200 futures overnight show a market that may be losing some steam
- RSI (2) has reached overbought on the daily chart and the 1-hour RSI (2) has formed a bearish divergence with prices
- Price action is also oscillating as it grinds higher to suggest a falling wedge (bearish reversal) pattern could be forming on the 1-hour chart
- With upside potential limited, bulls may want to tighten stops or seek to fade into moves towards the 7850 handle and seek mean reversion lower.
View the full economic calendar
-- Written by Matt Simpson
Follow Matt on Twitter @cLeverEdge
How to trade with City Index
You can trade with City Index by following these four easy steps:
-
Open an account, or log in if you’re already a customer
• Open an account in the UK
• Open an account in Australia
• Open an account in Singapore
- Search for the market you want to trade in our award-winning platform
- Choose your position and size, and your stop and limit levels
- Place the trade
Latest market news
Yesterday 01:32 PM
Yesterday 09:35 AM
Yesterday 07:23 AM
Yesterday 04:48 AM
Yesterday 12:17 AM
July 25, 2024 10:39 PM
Latest Asian Open articles

July 25, 2024 10:39 PM

July 24, 2024 10:10 PM

July 23, 2024 11:29 PM

July 22, 2024 10:43 PM