


The Bureau of Labor Statistics release their monthly inflation report in a few hours. Using data since 2007, I have used the actual release dates of the report to generate average and median returns for the US dollar index, gold, Nasdaq 100 and S&P 500. Average and median returns have been generated on a per-day basis.
T-3 = Three days prior to the CPI report
T-2 = two days prior
T-1 = one day prior
T-0 = CPI day
T+1 = the day after CPI day
T+2 – the second day after CPI
T+3 = the third day after CPI
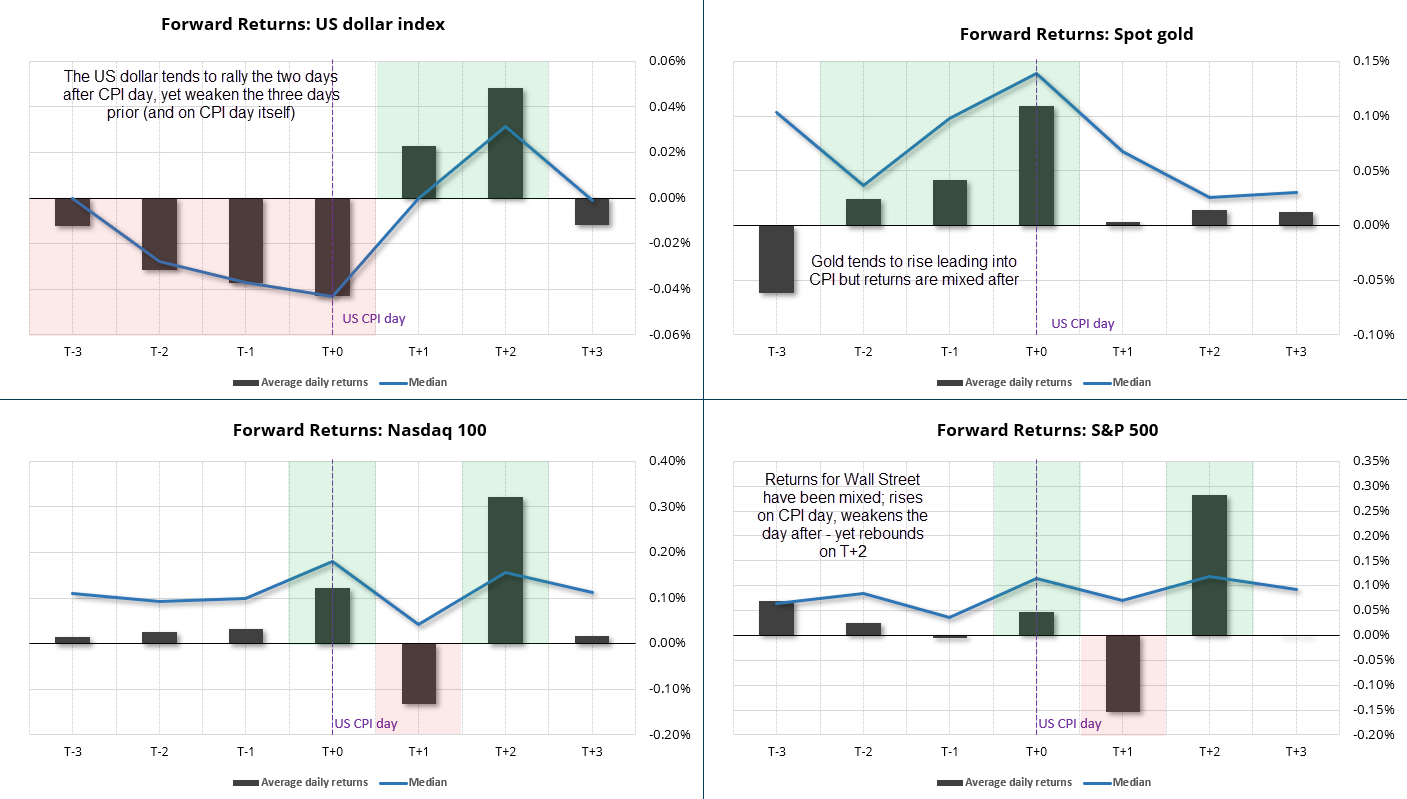
Observations on performance around US CPI
- The US dollar index: It tends to fall in the three days leading up to and on the day of the CPI announcement (based on average and median returns). Interestingly, it usually rises on the two days after (T+1 and T+2).
- Gold: This precious metal typically sees its strongest gains on CPI day itself, with positive average and median returns. It also tends to rise in the two days before the announcement.
- S&P 500 and Nasdaq: These stock indexes show a mixed picture. On average, they experience positive returns on CPI day, but then dip slightly on the following day (T+1) before recovering on T+2. Importantly, both indexes tend to have positive returns overall in the T-3 to T+3 period, suggesting a generally positive response to CPI news.
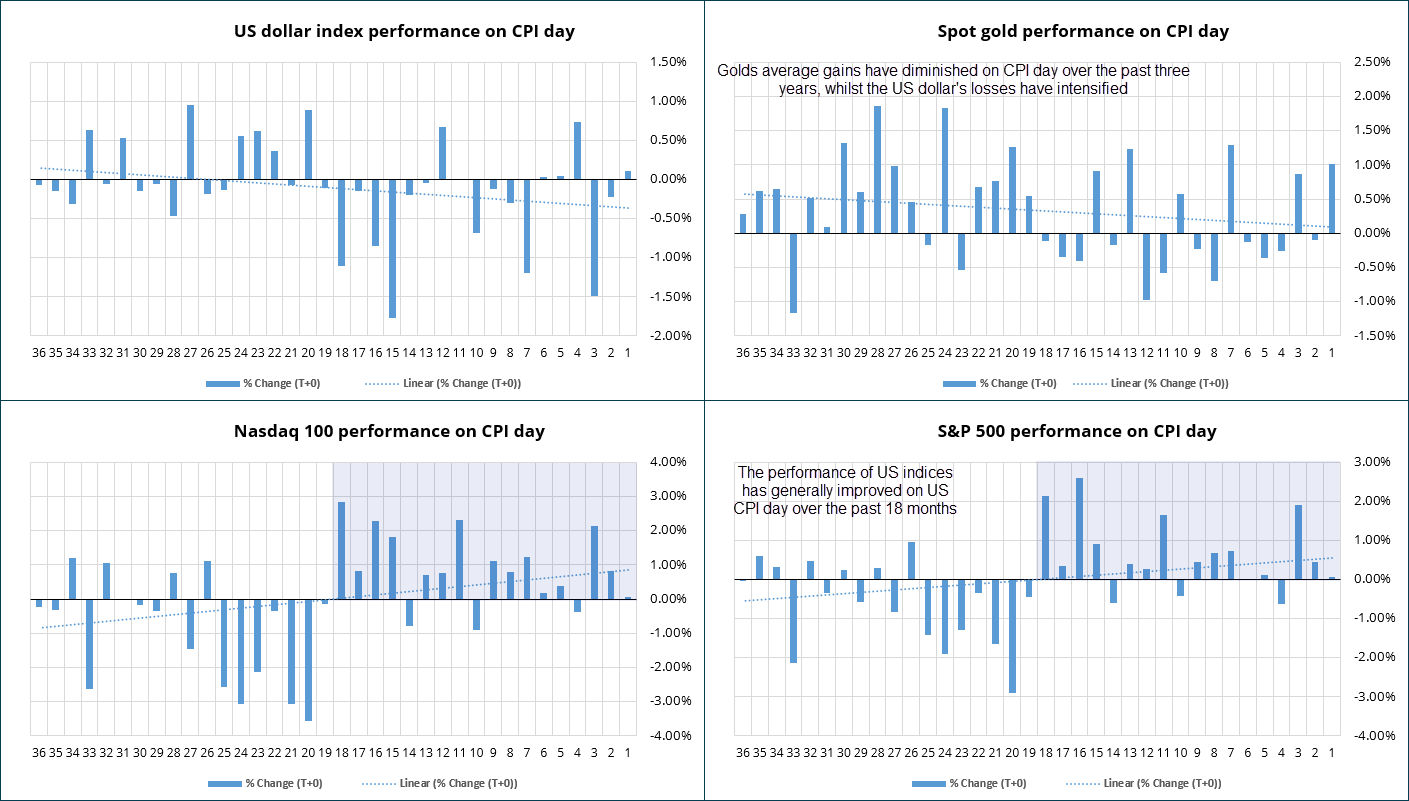
I then looked at individual returns for CPI day over the past three years to see if any trends are present.
- The performance of US indices has actually improved on CPI day over the past 18 months
- The prior 18 months were littered with negative returns on CPI day
- US dollar index losses have intensified on CPI day over the past three years
- Gold’s gains of CPI have diminished over the past three years
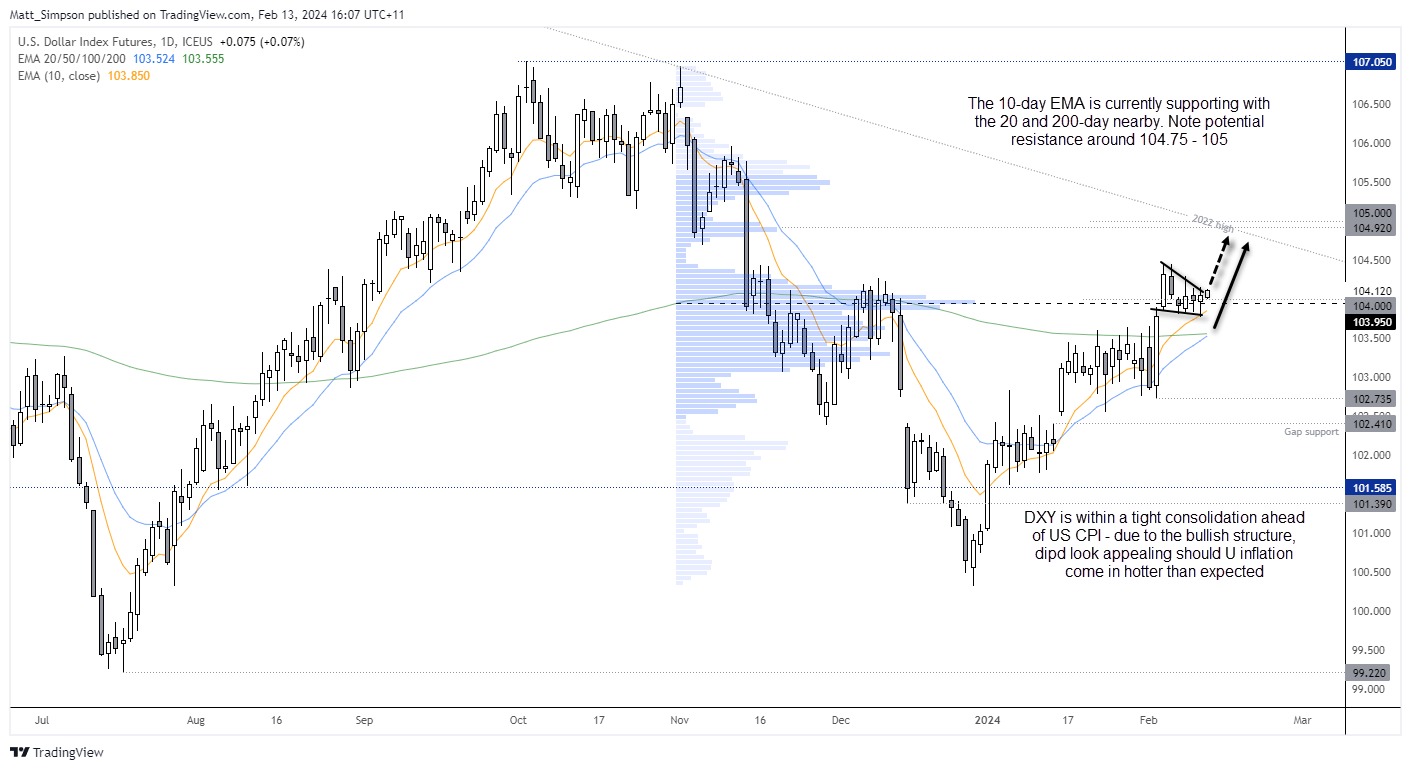
US dollar index technical analysis (daily chart):
The daily chart shows the US dollar index remains in a steady uptrend, and it is holding in a tight consolidation pattern ahead of today’s key inflation report. Given the potential for volatility and ‘false’ moves ahead of the release, I’m hoping for a spike or two lower before the trend resumes.
The 10-day EMA is providing support, and even if we get a sudden selloff then the 200-day EMA sit just above 103.50, and that may not be so easy to crack. But with the US dollar’s pattern of rising at T+1 (Wednesday) and T+2) after the US CPI release combined with a bullish trend structure, I see its potential to head for the 104.75 – 105 area. Bulls may want to keep in mind that trend resistance resides in that area.
-- Written by Matt Simpson
Follow Matt on Twitter @cLeverEdge
How to trade with City Index
You can trade with City Index by following these four easy steps:
-
Open an account, or log in if you’re already a customer
• Open an account in the UK
• Open an account in Australia
• Open an account in Singapore
- Search for the market you want to trade in our award-winning platform
- Choose your position and size, and your stop and limit levels
- Place the trade
Latest market news
April 25, 2024 03:09 PM
April 25, 2024 03:00 PM
April 25, 2024 01:12 PM
Latest Trade Ideas articles


April 25, 2024 03:00 PM

April 25, 2024 11:14 AM
April 24, 2024 11:00 AM