


Market Summary:
- There were no surprises in Thursday’s US employment figures to provide much of a lead for today’s nonfarm payroll report, with jobless claims rising a modest 2,000, continuing claims down -1,000. Although layoff rose 47.5k, down from 75.2k previously.
- Fed’s Daly warned there are “real risks” with the Fed’s inflation projection, and that the Fed need to see progress on super-core inflation to be sure they are on target for 2% (super core CPI is services less energy and housing)
- Bank of England’s (BOE’s) deputy governor Ben Broadbent said that it remains an open question as to whether further interest rate hikes are required
- Bond prices stabilised for a second day, helping yields moderate and send the US dollar lower again on Thursday.
- This allowed Wall Street indices to hold their ground again, and while they fell far short from any sort of rebound the S&P 500, Dow Jones and Nasdaq 100 held above their recent cycle lows
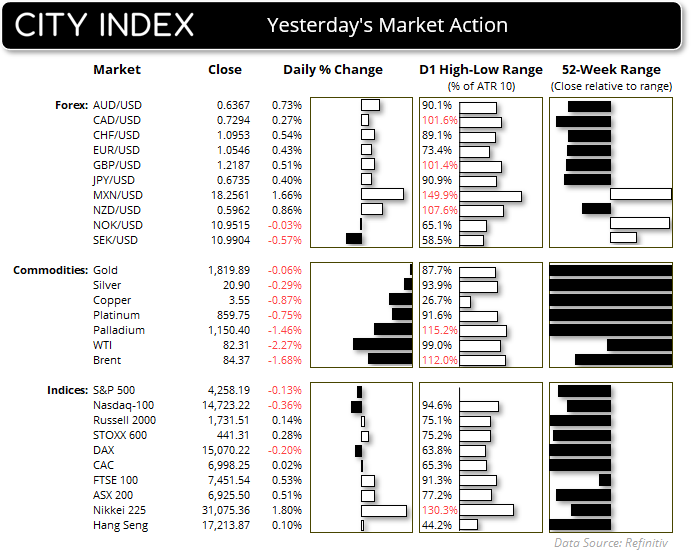
- If there were any signs of risk-on it could be seen on NZD/USD and AUD/USD, which rose 0.9% and 0.7% respectively and were the day’s strongest forex majors. USD was the weakest FX major.
- The Nikkei 225 rallied from its 200-day EMA in line with yesterday’s bias, although its upside potential from here depends on sentiment today across the APAC region ahead of the NFP report (so we may find its upside potential is limited if investors de-risk)
- WTI crude oil extended its slide and closed beneath the January and April highs, which brings the 200-day EMA into focus just above the $80 handle
Events in focus (AEDT):
- Public holiday in China
- 10:30 – Japan wage data, Japan household spending, wages
- 11:30 – RBA Financial Stability Review
- 23:30 – Nonfarm payroll
- 23:30 – Canadian employment report
ASX 200 at a glance:
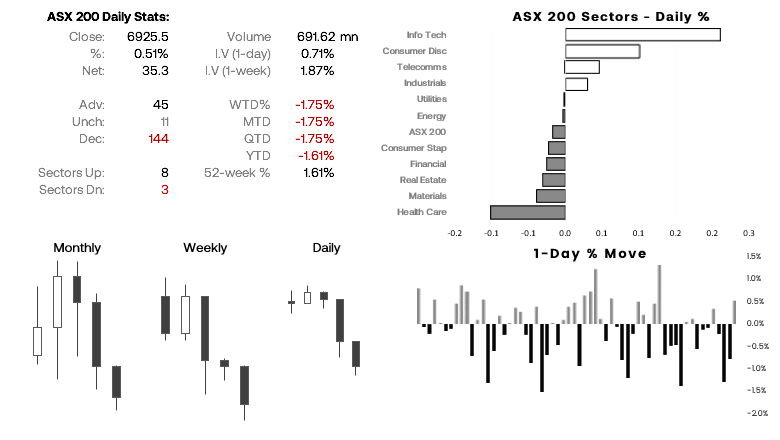
- The ASX 200 formed a small bullish inside day on Thursday, and managed to close back above key support around 6900
- SPI futures were flat and the underwhelming close on Wall Street makes for an uninspiring open
- Due to the lack of relevant data and NFP hanging in the air, happy to have a neutral bias for the day and wait for better clues next week
- If I had to pick a direction, perhaps it can move higher as it reclaimed key support on Thursday – but just how far depends on sentiment across the APAC region today
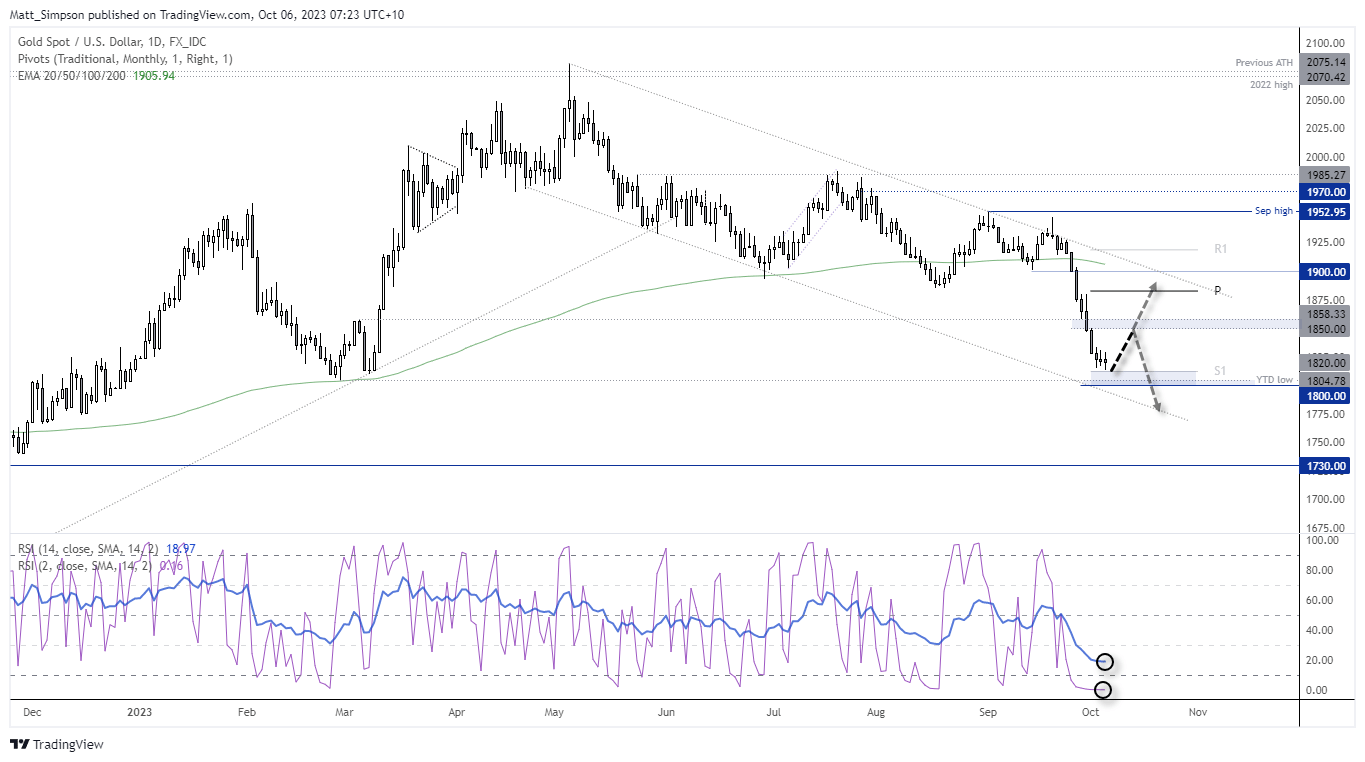
Gold technical analysis (daily chart):
I’ll admit that the decline in gold towards 1800 unfolded much faster than I expected. But after nine consecutive bearish days, the last three of which have been much smaller ranges with higher and lower wicks, perhaps it is time to mean revert higher. 1800 is a level of support I suspect to be vigorously defended, at least initially. Therefore bulls could seek dips towards that level, wait for a break above the current consolidation highs or simply enter at market within the consolidation if confident an inflection point is near. The 1850 – 1858 zone makes a likely resistance area, where I’ll reassess its potential for a swing high or breakout towards the upper trendline of the channel if it rallies from current levels.
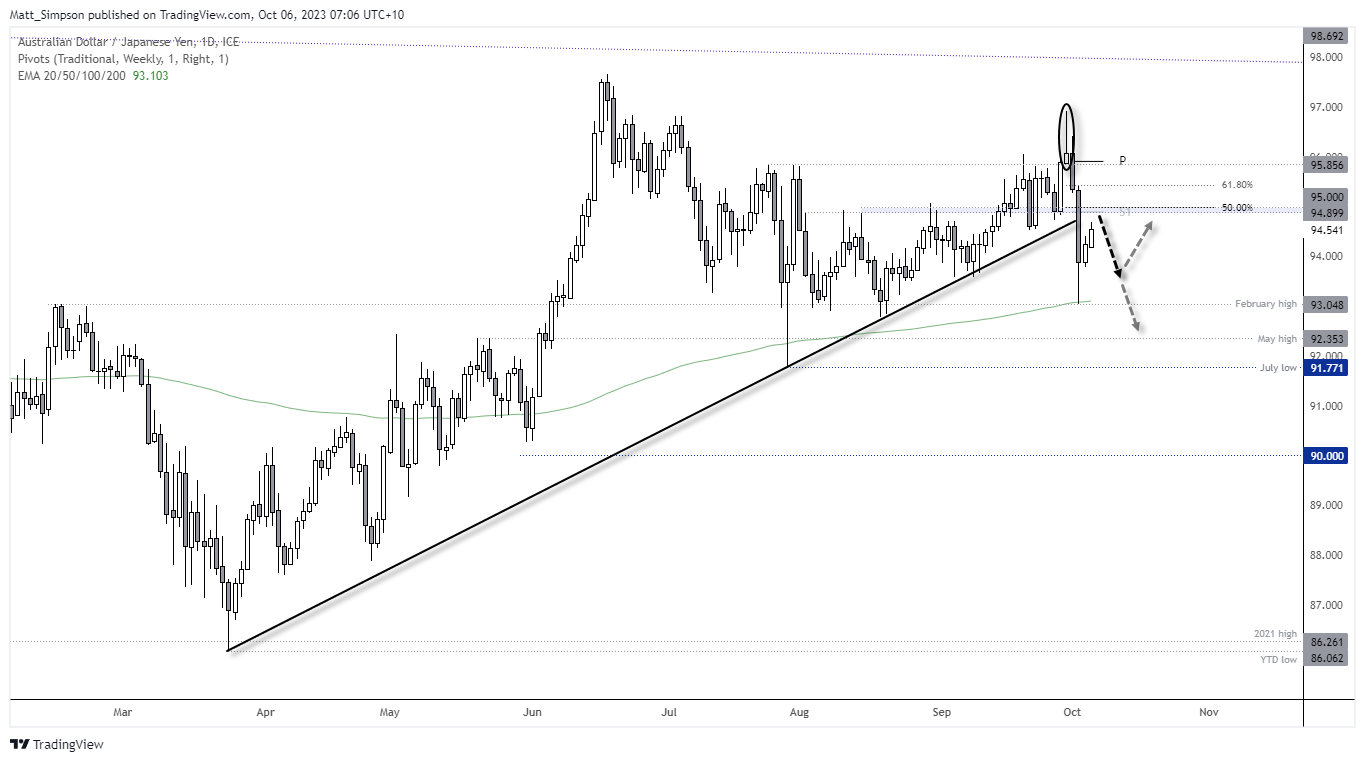
AUD/JPY technical analysis (daily chart):
A classic barometer of risk for currency traders, AUD/JPY saw a -4% decline from Friday’s shooting star high and Tuesday’s low before the 200-day EMA and February high came to the rescue. We have since seen two modest up days, which raises the question as to whether we’re approaching an inflection point for its next leg lower – which would make this a dead-cat bounce (DCB). A true DCB would require a break of Tuesday’s low, and that would assume another round of large-scale risk-off. The reality is that I have no idea as to if that will occur, but I do suspect the pair will at least move lower initially and try and retest those lows – which itself could provide an opportunity to enter short.
The key, if ever there was one, is to monitor lower timeframes and seek clear evidence of a momentum shift lower (for example, a bearish engulfing candle on the 1-hour,). If this occurs around resistance it can provide greater confidence a swing high is in place). Take note that the weekly S1, 50% retracement level, broken trendline and prior swing highs land around 95.0, which make it an area of interest for bearish setups.
View the full economic calendar
-- Written by Matt Simpson
Follow Matt on Twitter @cLeverEdge
How to trade with City Index
You can trade with City Index by following these four easy steps:
-
Open an account, or log in if you’re already a customer
• Open an account in the UK
• Open an account in Australia
• Open an account in Singapore
- Search for the market you want to trade in our award-winning platform
- Choose your position and size, and your stop and limit levels
- Place the trade
Latest market news
Yesterday 08:00 PM
Yesterday 08:00 AM
Yesterday 02:00 AM
May 3, 2024 01:03 PM
Latest Asian Open articles

May 1, 2024 10:19 PM

April 30, 2024 10:08 PM
April 29, 2024 10:44 PM

April 23, 2024 11:09 PM