


DJIA, S&P 500, Nasdaq 100 Key Points
- The increasingly likelihood of an interest rate cut by September and slower balance sheet runoff at the Fed are a powerful catalyst boosting indices.
- After solid results from Amazon and Apple last week, the earnings calendar slows down over the next week.
- The Dow Jones, S&P 500, and Nasdaq 100 all recaptured key technical levels, carrying a bullish bias to the coming week.
DJIA, S&P 500, Nasdaq 100: Week in Review
US (and global) indices went on a wild ride last week, highlighted by a big swoon on Tuesday following the hotter-than-expected Employment Cost Index (+1.2% q/q) before reversing the early week losses and finishing the week solidly higher on the back of a relatively dovish Fed meeting and a weaker-than-expected US jobs report.
From a macro perspective, the recent price action in indices can be boiled down to changes in the outlook for the Fed’s monetary policy. As of writing on Friday afternoon, the odds of a Fed interest rate cut by September have rise from roughly 58% this time last year to 70% now, and this expectation of lower interest rates has boosted all US indices. For the uninitiated, interest rates exert a direct cost on businesses that borrow money (so, essentially all of them), but they also impact the relative attractiveness of stocks and bonds; if interest rates are now expected to fall faster/sooner, that makes stocks relatively more compelling than bonds, all else equal.
One other aspect of the Fed meeting that is supporting indices was the decision to taper the central bank’s balance sheet runoff. Basically, instead of allowing $60B in treasuries to runoff each month, it will now only allow $25B, effectively adding (or at least not removing) $35B in liquidity every month. This also supports stock prices and generally suppresses interest rates.

Source: TradingView
While the macro backdrop is always significant, it’s also worth highlighting the micro themes at play in indices…and this time of year, that means earnings. The two big highlights last week were “Magnificent Seven” members Amazon (AMZN) and Apple (AAPL).
Starting with the company that Jeff Bezos built, Amazon reported robust first-quarter earnings, exceeding expectations with $0.98 in EPS against a forecast of $0.83 and $143.3 billion in revenue versus the expected $142.5 billion. Significant growth was driven by its advertising and AWS sectors, with a remarkable operating income increase of over 200%. In Apple’s case, the company reported earnings of $1.53 per share and $90.75 billion in revenue, exceeding forecasts, and announced the largest stock buyback program in U.S. history at $110 billion. However, overall sales fell by 4% and iPhone sales declined by 10% year-over-year, reflecting decreased demand for the latest iPhone models. Both stocks closed solidly higher on the week, dragging indices higher in sympathy.
DJIA, S&P 500, Nasdaq 100: What to Watch This Week
After last week’s fireworks, the US economic calendar mostly calms down in the coming week. For index traders, only the two treasury bond auctions (10yr tenor on Wednesday, 30yr tenor on Thursday) and Friday’s UofM Consumer Sentiment survey (and the associated inflation expectations) have a chance to influence the stock market to any appreciable extent.
Earnings similarly calm down as we reach the backside of peak Q1 earnings season. The key reports to watch are highlighted below:
Monday
Palantir (PLTR)
Tuesday
BP (BP)
Disney (DIS)
UBS (UBS)
Wednesday
AirBnb (ABNB)
ARM Holdings (ARM)
Shopify (SHOP)
Uber (Uber)
Thursday
Petrobas (PBR)
Friday
No top-tier earnings reports expected
Against this backdrop, expect traders continue to digest last week’s NFP report and FOMC meeting (especially with Fed speakers exiting their media blackout), as well as watch central bank meetings from the Reserve Bank of Australia (Tuesday) and Bank of England (Thursday).

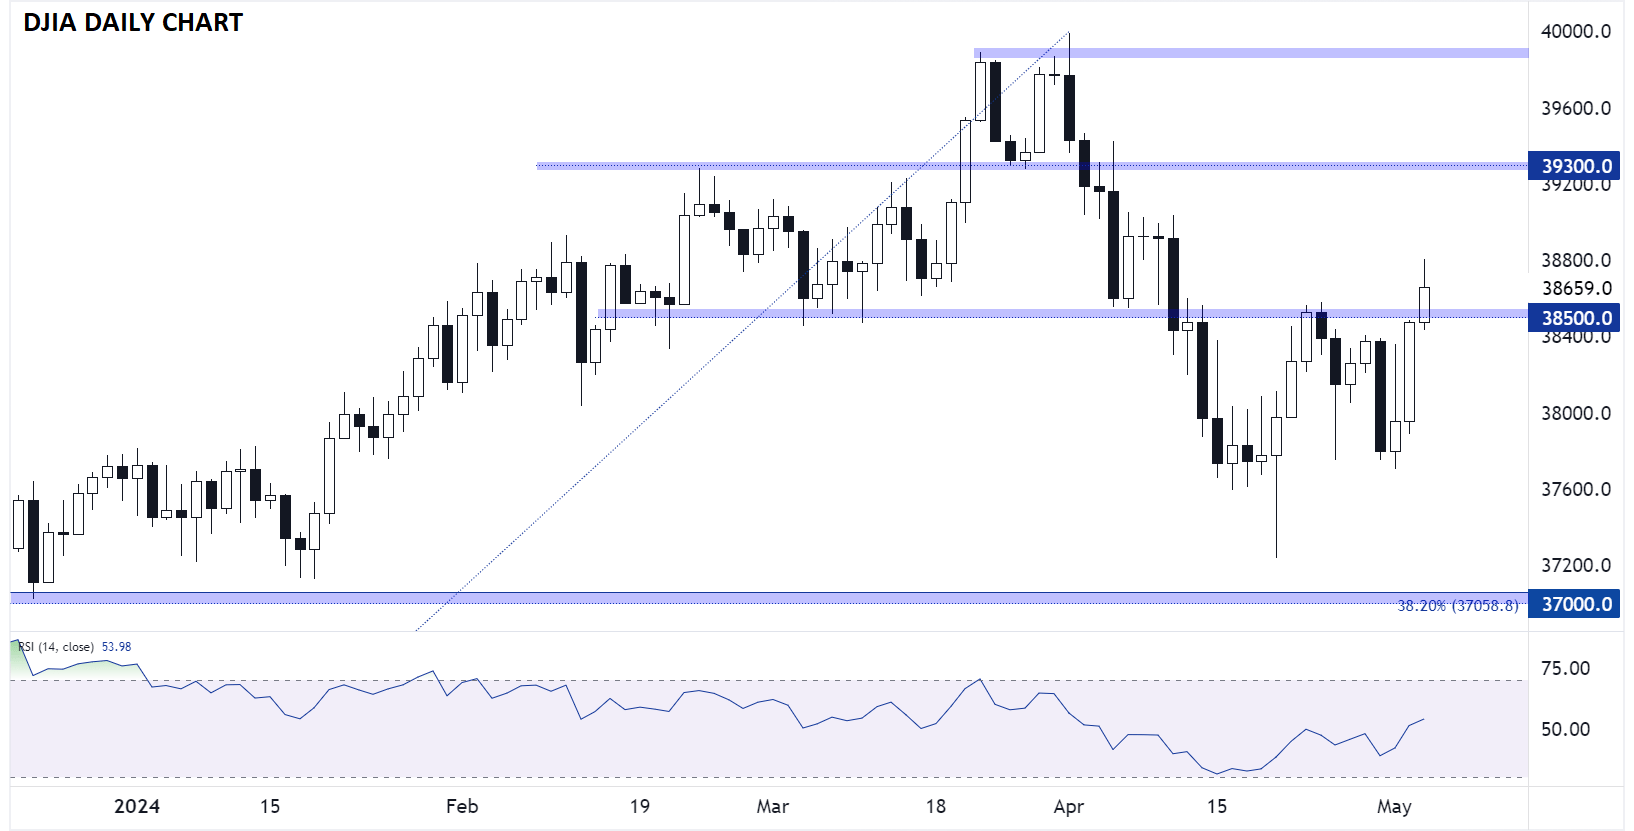
Dow Jones Technical Analysis – DJIA Daily Chart
Source: TradingView, StoneX
Turning our attention to the technicals, Friday’s rally in the Dow was particularly significant. The 30-stock index managed to close back above the key 38,500 level that has consistently provided both support and resistance over the last 2.5 months. As long as the index holds above that level, the path of least resistance will remain to the topside, in-line with the longer-term uptrend, with little in the way of resistance until closer to 39,300.
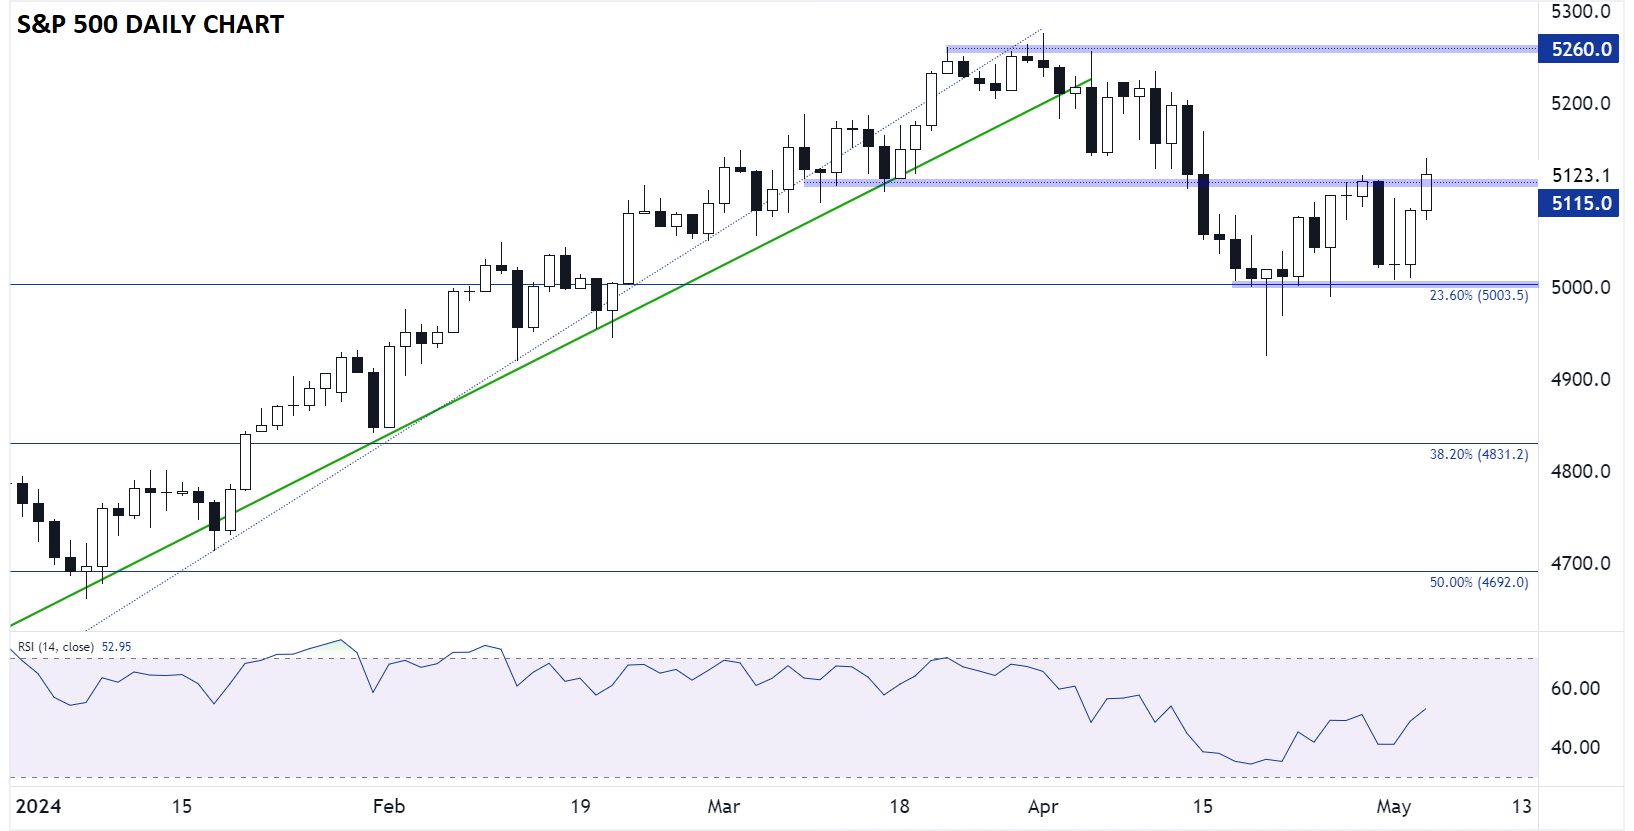
S&P 500 Technical Analysis – SPX Daily Chart
Source: TradingView, StoneX
The broader S&P 500 regained a similarly significant technical milestone on Friday, in its case at 5,115. While it feels optimistic to assume that the S&P 500 dip could be limited to just ~5% after such a strong rally off the November lows, both the fundamental and technical backdrop is suggesting that bulls have the upper hand as long as prices hold above that 5,115 level. The next level of resistance to watch is the all-time record high in the upper-5,200s.
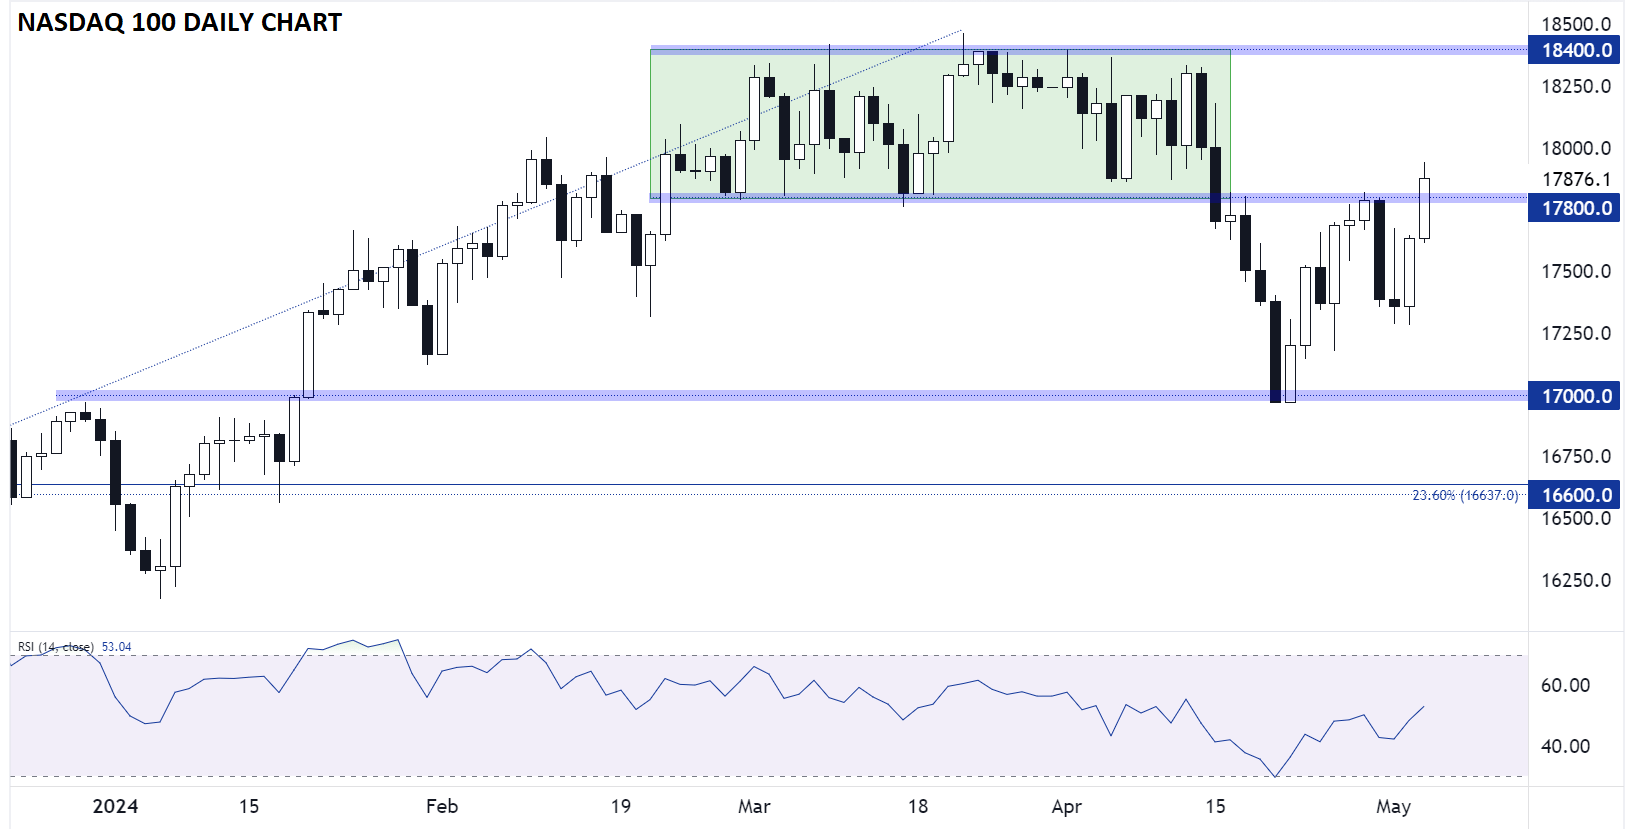
Nasdaq 100 Technical Analysis – NDX Daily Chart
Source: TradingView, StoneX
Stop me if you’ve heard this one before: The Nasdaq 100 also recaptured a key technical level at the bottom of its March range at 17,800. The only noteworthy resistance level nearby is the record highs near 18,400, though bulls may struggle to push it immediately back to those level this week with little in the way of fresh catalysts and plenty of overhead supply looming.
-- Written by Matt Weller, Global Head of Research
Follow Matt on Twitter: @MWellerFX
Latest market news
Yesterday 01:32 PM
Yesterday 09:35 AM
Yesterday 07:23 AM
Yesterday 04:48 AM
Yesterday 12:17 AM
July 25, 2024 10:39 PM
Latest US SP 500 articles


July 11, 2024 07:45 PM

June 18, 2024 01:57 PM

May 24, 2024 11:52 AM