


Asian Indices:
- Australia's ASX 200 index fell by -87.2 points (-1.17%) and currently trades at 7,363.50
- Japan's Nikkei 225 index has fallen by -667.48 points (-1.99%) and currently trades at 32,809.01
- Hong Kong's Hang Seng index has fallen by -397.61 points (-1.99%) and currently trades at 19,613.51
- China's A50 Index has fallen by -137.12 points (-1.03%) and currently trades at 13,115.42
UK and Europe:
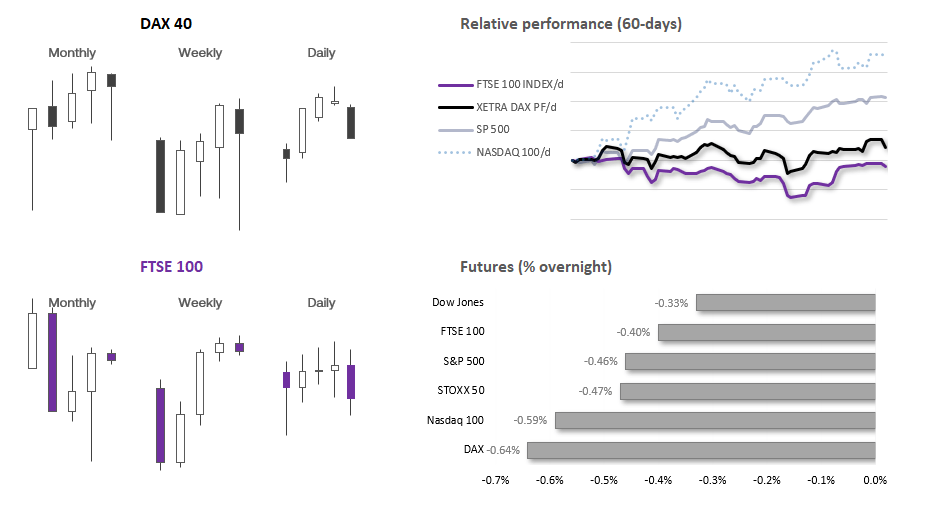
- UK's FTSE 100 futures are currently down -32.5 points (-0.42%), the cash market is currently estimated to open at 7,633.77
- Euro STOXX 50 futures are currently down -23 points (-0.52%), the cash market is currently estimated to open at 4,384.54
- Germany's DAX futures are currently down -110 points (-0.67%), the cash market is currently estimated to open at 16,130.40
US Futures:
- DJI futures are currently down -116 points (-0.32%)
- S&P 500 futures are currently down -21 points (-0.46%)
- Nasdaq 100 futures are currently down -90.25 points (-0.57%)
The US had their credit rating downgraded for their second time in history by Fitch on Tuesday night, although the relatively muted market reaction suggests there may not be much of a bearish follow-through. With that said, the US dollar and Japanese yen are currently the strongest majors whilst index futures are pointing lower, but one may have expected more than -0.3% to -0.5% shaved from index futures given the potential ramifications from the main headline. Perhaps Asian trade is not quite sure what to make of the headline and we’ll see the real commotion in today’s European and US sessions.
The last time the US lost its triple-A status in 2011. The S&P 500 fell -6.5% the following day, although the market was already within an established bear market at the time.
- A bearish engulfing candle formed on the FTSE 100 daily chart to suggest a retracement could be due following its strong rally from the July low
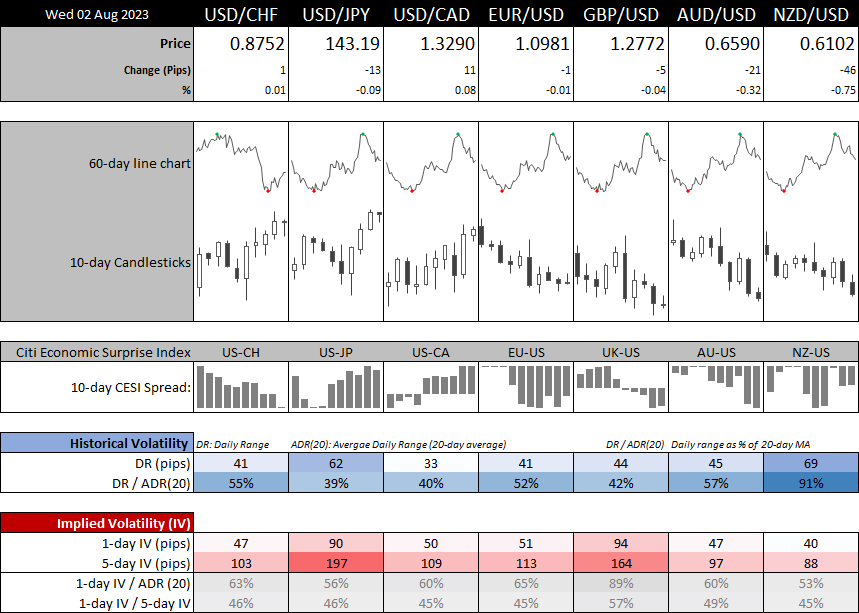
- AUD/USD has fallen to a 2-month low during a slightly-risk off session overnight, with weak PMI data also adding to a bearish case following the RBA’s dovish meeting
- EUR/USD has pulled back to trend support on the daily chart from the 7 July low, although two lower wicks show demand around 1.0950 (a break beneath which suggests further downside)
- WTI crude oil has gapped up to its highest level since April, which likely makes $82 a pivotal level for intraday traders today
- US futures markets are lower due to the US credit rating downgrade, which makes today’s question as whether we’ll see a bearish follow-through or risk-on rebound later today
- Despite the potential for a risk-off session, 1-day implied volatilities for FX majors remain contained and beneath their 20-day averages
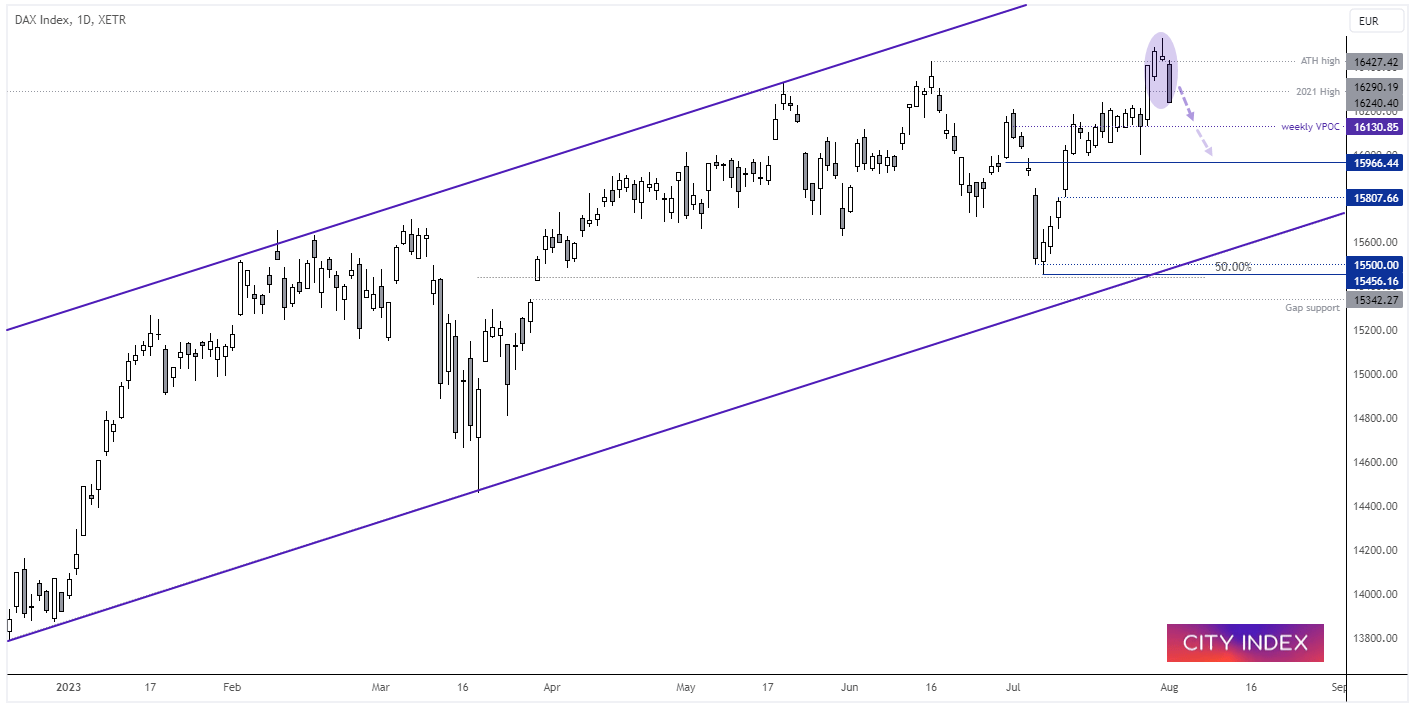
DAX 40 daily chart:
The DAX suffered its worst day in 18 yesterday and closed at a 3-day low, just one session after hitting a record high. The candle also forms the last part of a 3-bar bearish reversal (evening star formation).
That makes it the third time in a row it has been toppled after reaching a record high, and sentiment heading into today’s session isn’t exactly looking rosy. From here, bears may seek to fade into moves below 16300, with 16,000 being the next major level of support.
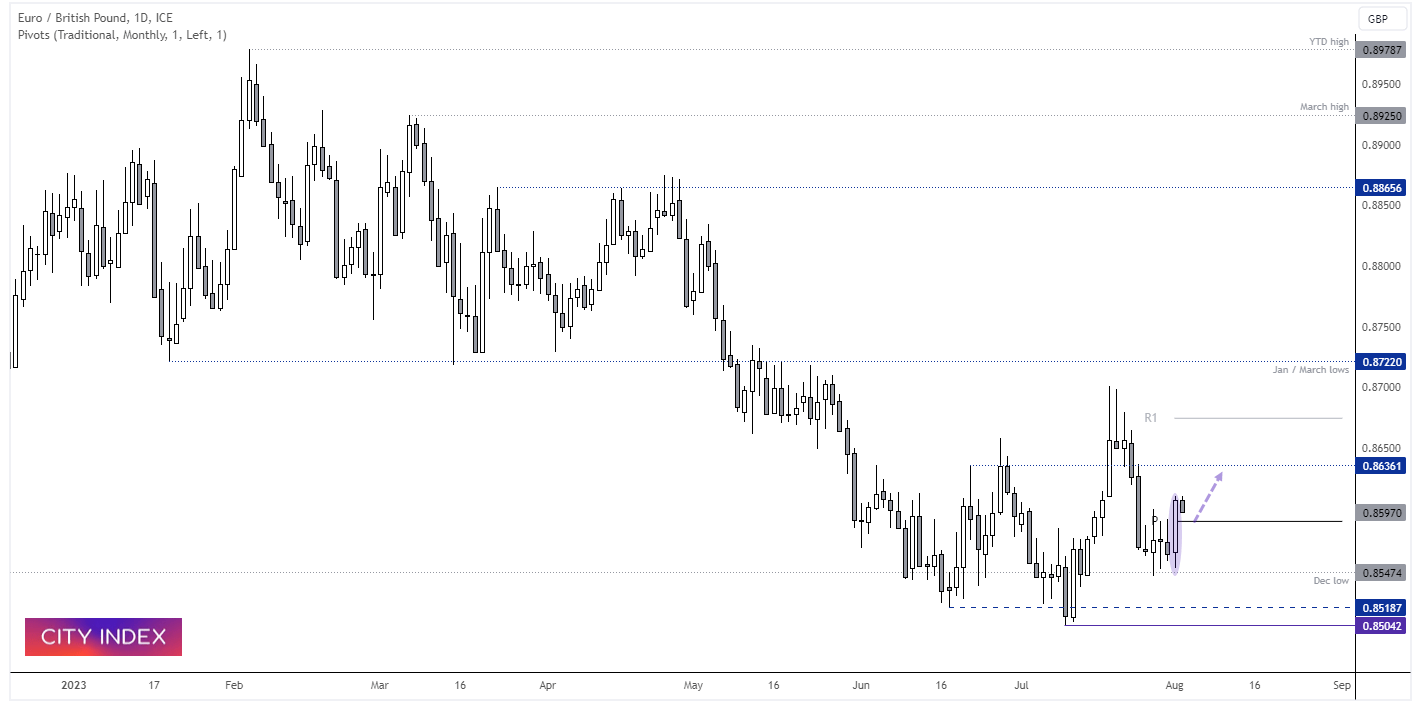
EUR/GBP daily chart:
EUR/GBP may be a good forex chart to watch to avoid the potential fallout from the US credit downgrade. The daily timeframe has presented some decent swings, and its false break of the June low led to a rally from 0.85, and prices have now retraced against that move (yet held above the December low). A bullish candle formed to show range expansion yesterday, and prices are pulling back from its highs towards the monthly pivot point and Monday’s high ahead of the open. We’re now looking for prices to move towards 0.8636.
View the full economic calendar
-- Written by Matt Simpson
Follow Matt on Twitter @cLeverEdge
How to trade with City Index
You can trade with City Index by following these four easy steps:
-
Open an account, or log in if you’re already a customer
• Open an account in the UK
• Open an account in Australia
• Open an account in Singapore
- Search for the market you want to trade in our award-winning platform
- Choose your position and size, and your stop and limit levels
- Place the trade
Latest market news
Yesterday 06:37 AM
April 26, 2024 01:25 PM
April 26, 2024 11:40 AM
Latest Trade Ideas articles


April 26, 2024 11:40 AM

April 25, 2024 03:00 PM

April 25, 2024 11:14 AM