


September 1, 2022 5:23 AM

Canadian GDP for Q2 showed that that the economy grew by 3.3% annualized vs an expectation of 4.4% and a Q1 reading of 3.1%. However, what may be of more concern for the economy is the GDP Implicit Price, otherwise known as the deflator. The inflation component was also 3.3% vs an expectation of only 3.1% and a Q1 reading of 3%. Lower than expected growth and higher than expected inflation. Sounds a bit familiar! In addition, to kick off Q3, the preliminary July reading was -0.1% MoM vs an expectation of +0.3% MoM. Not a good start to the quarter, however, markets are expecting a 75bps rate hike when the BOC meets next week.
Everything you need to know about the Bank of Canada
USD/CAD has been moving in an upward sloping channel for over a year. On June 22nd, the pair tested the bottom side of the channel near 1.2549 and began moving in an ascending wedge formation. As is often the case, when price fails to move through once side of a channel if often moves to test the opposite side. On July 14th, the pair pierced through the top of the channel and reached a near-term high to 1.3224 before pulling back. USD/CAD then moved to the 200 Day Moving Average and couldn’t break through, forming a higher low for the ascending wedge. The pair is now moving once again to test the top trendline and the prior highs from July 14th.
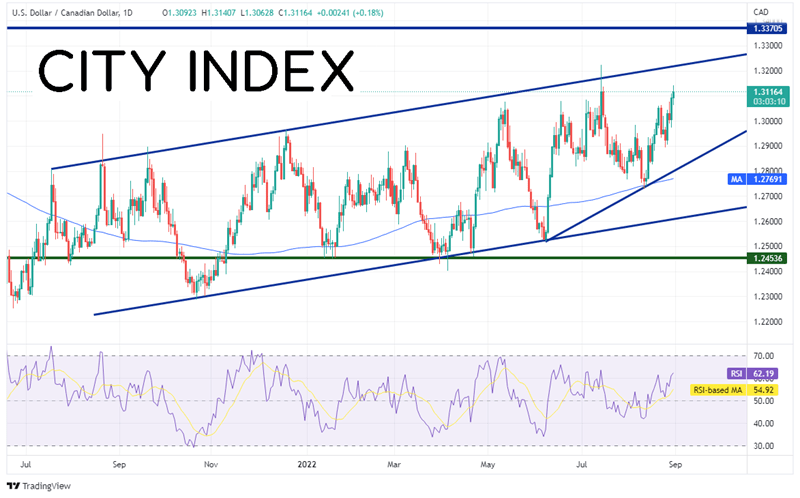
Source: Tradingview, Stone X
Trade USD/CAD now: Login or Open a new account!
• Open an account in the UK
• Open an account in Australia
• Open an account in Singapore
On the bottom panel of the 240-minute USD/CAD chart is the correlation between USD/CAD and WTI Crude Oil. The correlation coefficient is -0.84. Readings below -0.80 indicate a strong negative correlation between two assets. Therefore, it WTI Crude Oil moves in one direction, USD/CAD could be expected to move in the opposite direction (as long as the correlation remains below -0.80). Price is currently banging up against resistance at the top, upward sloping trendline of a smaller ascending wedge (within the larger ascending wedge on the daily timeframe). First resistance is at today’s high at 1.3073. Above there, price can move to a confluence of resistance at the long-term trendline and the highs of July 14th near 1.3224, and then the highs from the week of November 2nd, 2020 at 1.3371. First support is at the bottom trendline of the shorter-term rising wedge near 1.2960. Below there, USD/CAD can fall to the bottom trendline of the longer-term trendline near 1.2800 and then the lows from August 11th at 1.2728.
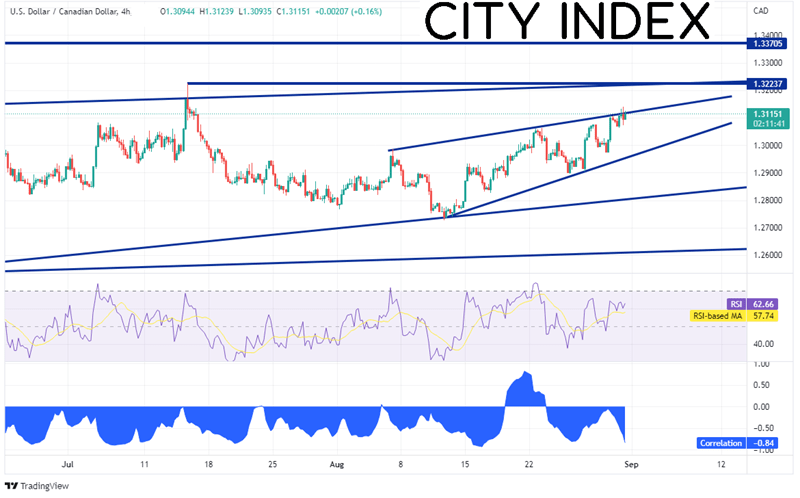
Source: Tradingview, Stone X
What factors move the price of oil?
Q2 GDP from Canada was lower than expected. However, the data was stale. The more important GDP piece was the monthly for July, which was -0.1%. Will this matter come the BOC’s interest rate decision meeting next week? It may depend on whether USD/CAD continues to follow the price of oil!
Learn more about forex trading opportunities.
Latest market news
April 25, 2024 03:09 PM
April 25, 2024 03:00 PM
April 25, 2024 01:12 PM
April 25, 2024 11:14 AM
Latest Trade Ideas articles


April 25, 2024 03:00 PM

April 25, 2024 11:14 AM
April 24, 2024 11:00 AM