


Asian Indices:
- Australia's ASX 200 index fell by -21.7 points (-0.31%) and currently trades at 7,016.50
- Japan's Nikkei 225 index has fallen by -83.32 points (-0.26%) and currently trades at 33,231.73
- Hong Kong's Hang Seng index has risen by 111.03 points (0.64%) and currently trades at 17,577.93
- China's A50 Index has risen by 8.6 points (0.07%) and currently trades at 12,486.14
UK and Europe:
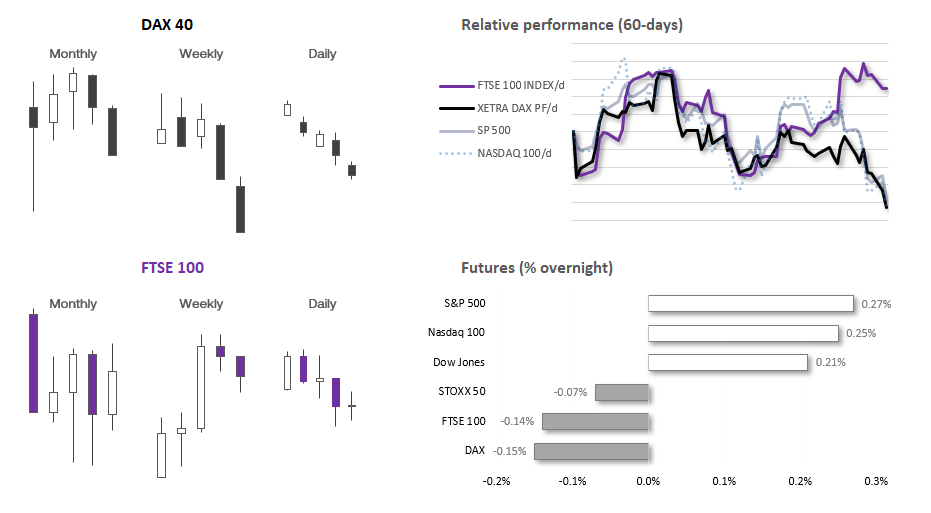
- UK's FTSE 100 futures are currently down -11.5 points (-0.15%), the cash market is currently estimated to open at 7,614.22
- Euro STOXX 50 futures are currently down -1 points (-0.02%), the cash market is currently estimated to open at 4,128.18
- Germany's DAX futures are currently down -16 points (-0.1%), the cash market is currently estimated to open at 15,239.87
US Futures:
- DJI futures are currently up 69 points (0.2%)
- S&P 500 futures are currently up 11.25 points (0.26%)
- Nasdaq 100 futures are currently up 32.5 points (0.22%)
Events in focus (GMT+1):
- 07:00 – Germany GfK consumer climate
- 09:00 – Swiss ZEW expectations
- 09:00 – EU loans
- 12:00 – US mortgage data
- 13:30 – US core durable orders
- 14:00 – SNB quarterly bulletin
- 15:30 – Crude oil inventories
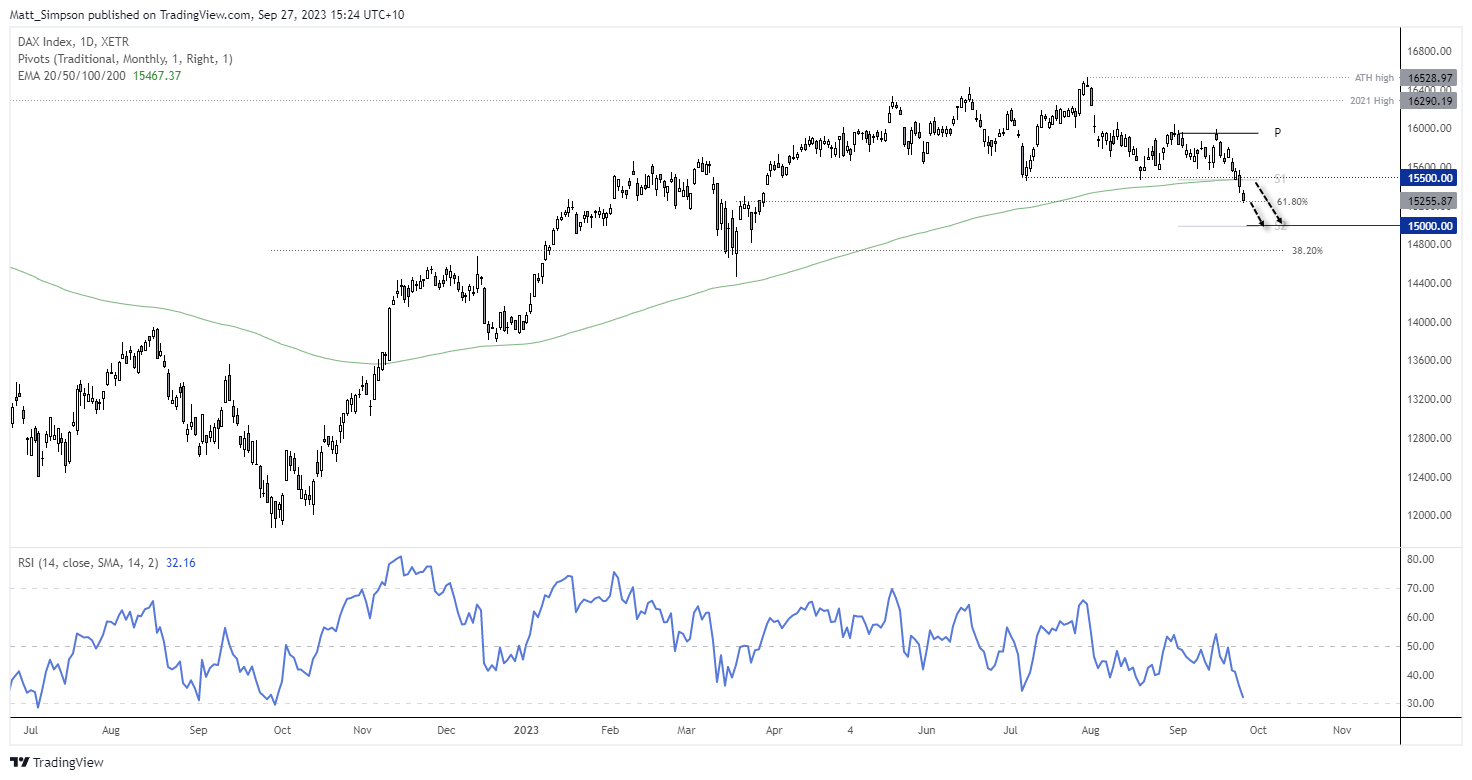
DAX technical analysis (daily chart)
The DAX has joined Wall Street at 6-month lows on Tuesday, having seen a decisive close beneath its 200-day EMA the day prior. Its low may have found support at a 61.8% Fibonacci retracement level, but unless sentiment can turn around fast it appears more likely the DAX could be headed for 15,000 before it retests its 200-day EMA. Besides, RSI (14) is not yet oversold on the daily chart, let alone form a bullish reversal to warn of a retracement higher. And unless we see prices print a particularly large bullish candle, any bounces higher are likely tempting to bears to fade into around resistance levels.
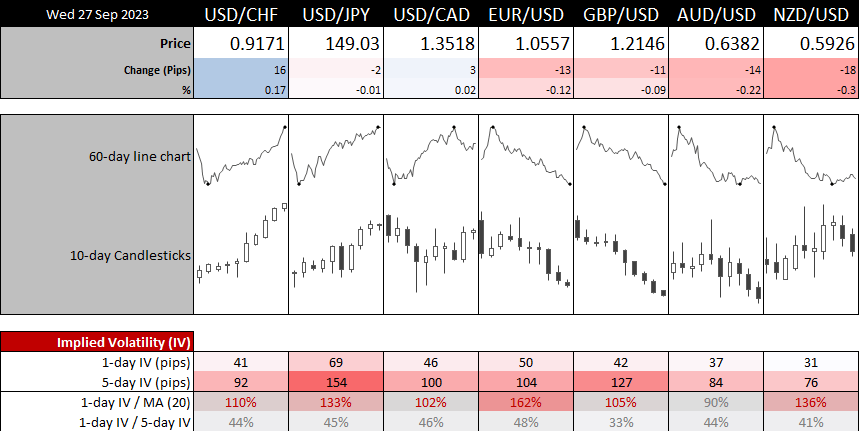
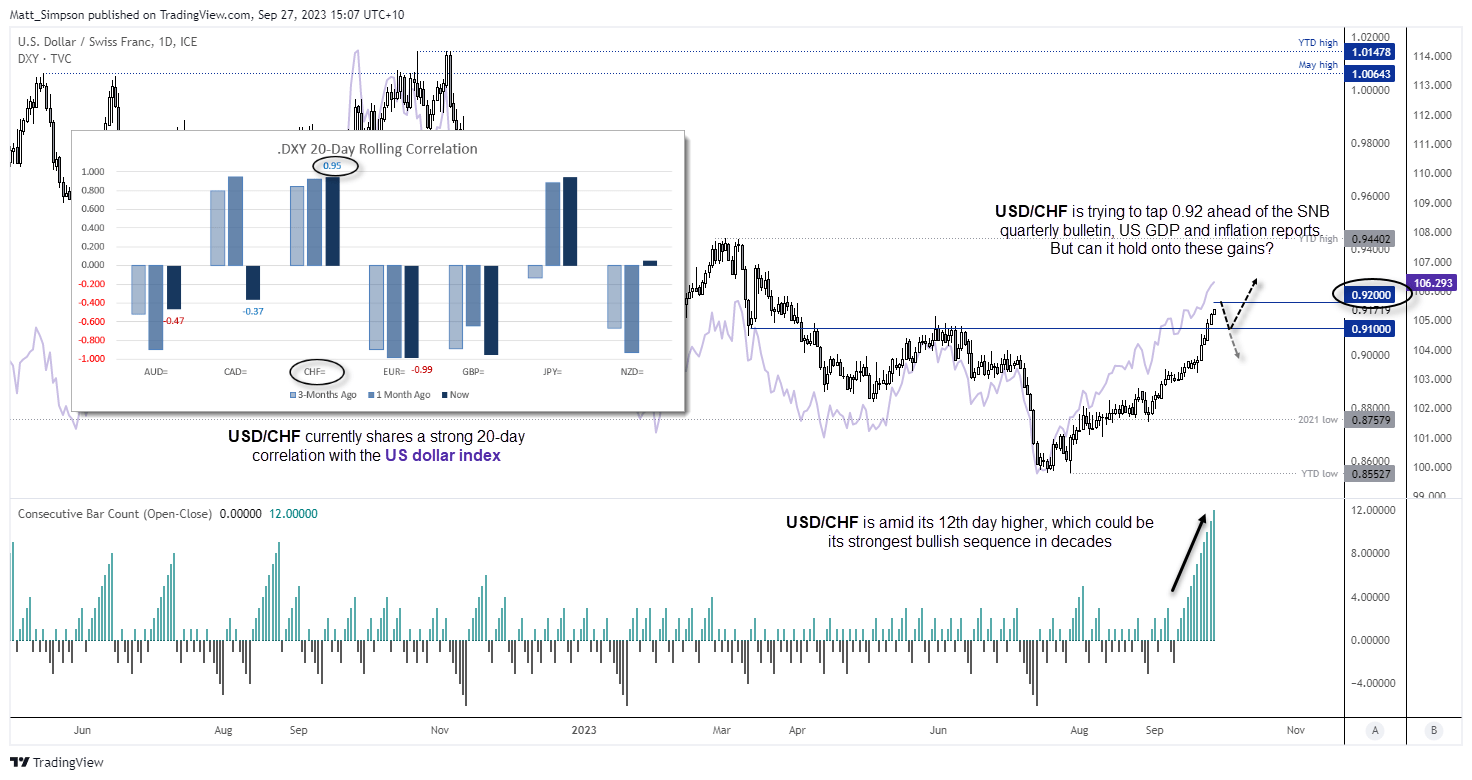
The US dollar index continued to rise during Wednesday’s Asian session to reach a fresh 10-month high. The US dollar has seen little in the way of pullbacks, which has seen GBP/USD and EUR/USD inch their way to fresh 6-month lows. But let’s not forget about the Swiss franc, which is trying to tally up its 12th consecutive day – a bullish sequence not seen since the 1970s.
USD/CHF is the ideal divergent theme with the ‘higher for longer’ and rising bond yields driving the US dollar, alongside an increasingly bearish view on the Swiss franc. The Swiss National Bank’ (SNBs) recent decision to announce the end of their tightening cycle clearly came as a surprise to many, given it has a relatively low interest rate of 1.75%. And that has seen its 20-day correlation with the US dollar index rise to 0.95, just a fraction between EUR/USD’s negative correlation of -0.99.
The SNB are not set to announce another monetary policy decision until 14 December, which leaves plenty of time for markets to sway their opinion. But the SNB will release their quarterly bulletin at 14:00 GMT+1 which will include an update to their global and domestic economic forecasts. Ad if CPI expectations come in lower, it could prompt more bears to return form the sideline and short the Swiss franc.
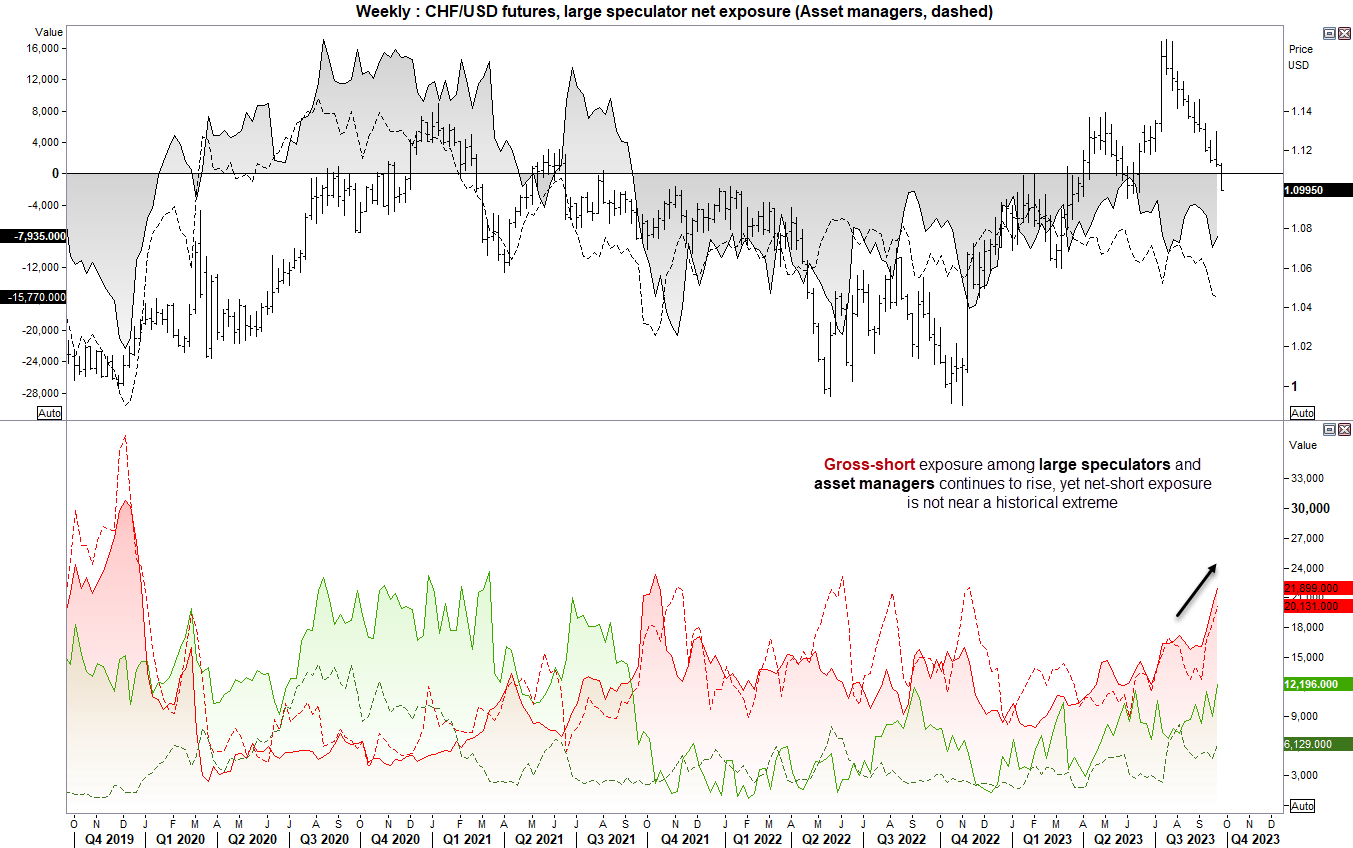
As of last week’s COT report, asset managers and large speculators saw a notable rise in gross-short exposure. Although net-short exposure does not appear to be near a historical extreme for either group.
Keep in mind that the US releases final GDP data on Thursday and PCE inflation on Friday, and that runs the risk of a retracement in the US dollar if data comes in soft enough. Especially when it’s considered that the US dollar has already rallied for 10 weeks and USD/CHF shares a strong correlation with it. But for now, dollar bulls seem happy to remain bid ahead of the key data sets.
USD/CHF technical analysis (daily chart):
The daily chart shows a very strong uptrend which has shown little in the way of any pullback. It is also amid its 12th day high, which suggests it could be fast approaching the need for a pullback. However, with no immediate signs of a top, and the apparent need to tap 0.92, bears may want to step aside until we see clear evidence of a momentum shift around its cycle highs. Perhaps this may occur around the US data scheduled on Thursday or Friday and trigger some sort of a shakeout.
Beyond that, a pull back to 0.9100 could be tempting to bulls. But trying to chase such an extended move at the cycle highs seems like a risky bet for bulls at present.
View the full economic calendar
-- Written by Matt Simpson
Follow Matt on Twitter @cLeverEdge
How to trade with City Index
You can trade with City Index by following these four easy steps:
-
Open an account, or log in if you’re already a customer
• Open an account in the UK
• Open an account in Australia
• Open an account in Singapore
- Search for the market you want to trade in our award-winning platform
- Choose your position and size, and your stop and limit levels
- Place the trade
Latest market news
Yesterday 06:37 AM
April 26, 2024 01:25 PM
April 26, 2024 11:40 AM
April 25, 2024 03:09 PM
April 25, 2024 03:00 PM
Latest Trade Ideas articles

April 26, 2024 11:40 AM

April 25, 2024 03:00 PM

April 25, 2024 11:14 AM
April 24, 2024 11:00 AM