


S&P 500 and Nasdaq 100 Key Points
- Despite big rallies in the stock market over the last month, the historically bullish Santa Claus Rally period hasn’t even started yet.
- Whether the stock market rallies over the next 7 days may have big implications for returns across all of 2024.
- Yesterday’s big bearish reversals in the DJIA, S&P 500, and Nasdaq 100 complicate the otherwise strongly bullish outlook.
The Santa Claus Rally
While many traders tend to call any stock market rally in December a “Santa Claus Rally,” there is a more formal definition…and despite the recent surge in indices, we haven’t even entered the Santa Claus Rally period yet, historically.
Yale Hirsch, the founder of the Stock Trader’s Almanac, first coined the term "Santa Claus Rally" back in 1972 and defined it as the last five trading days of one year and the first two trading days of the following year. According to Ryan Detrick at Carson Research, these 7 days are more likely to be higher than any other 7 days of the year, with the S&P 500 up nearly 80% of the time with an average return of 1.32%, going back to 1950.
Looking at the calendar, the official Santa Claus Rally period starts tomorrow, so if history is any guide, there’s a relatively high probability that even more presents may be the way for stock market bulls.
Notably, if the Santa Claus Rally fails to emerge and the S&P 500 falls over the next 7 days, that could be a headwind for all of 2024: If the S&P 500 falls during the last five days of one year and the first two days of the following year, it has historically only returned 5.0% in that next year (vs. 9.1% in all years and 10.2% when the index rallies over the Santa Claus Rally period).
One way or another, the two weeks of price action could be particularly interesting for stock market traders.
Dow Jones Industrial Average Technical Analysis – DJIA Daily Chart
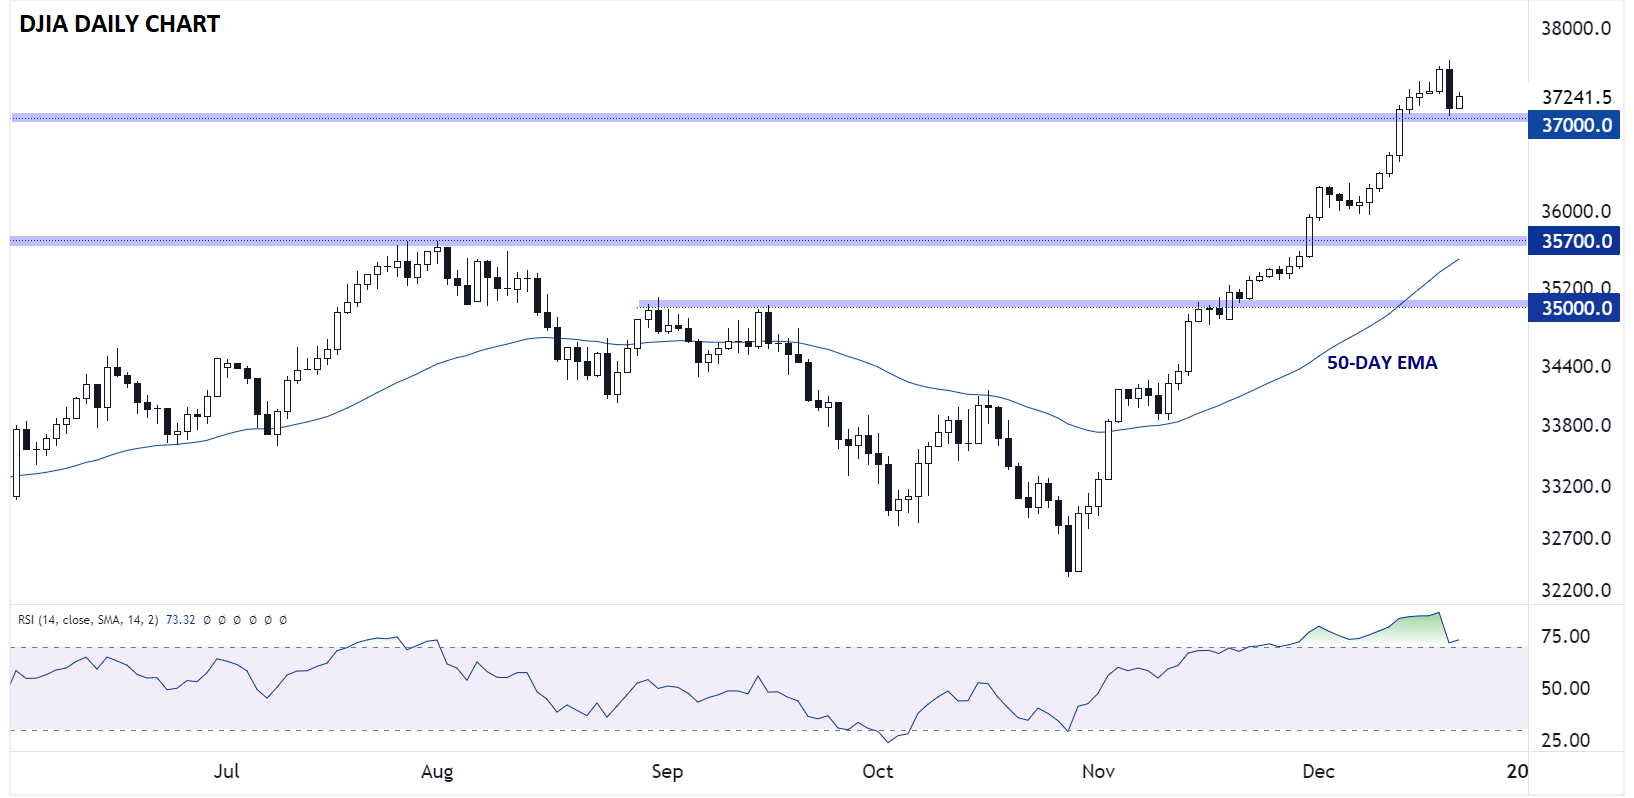
Source: TradingView, StoneX
Looking at the oldest US index, the Dow Jones Industrial Average (DJIA) hit a fresh all-time record high yesterday before reversing sharply to form a Bearish Engulfing Candle on the daily chart. For the uninitiated, a Bearish Engulfing candle is formed when the candle breaks above the high of the previous time period before sellers step in and push rates down to close below the low of the previous time period. It indicates that the sellers have wrested control of the market from the buyers and is often seen at near-term top sin the market.
In the short-term, the outlook for the Dow is relatively clear, as long as prices remain above previous-resistance-turned-support at 37K, the buyers will remain in control given the strong medium-term momentum and bullish seasonal window. However, a break below 37K heading into the new year would be a bearish sign and could point to a deeper pullback toward the next level of support and the rising 50-day EMA near 35,700.
S&P 500 Technical Analysis – SPX Daily Chart
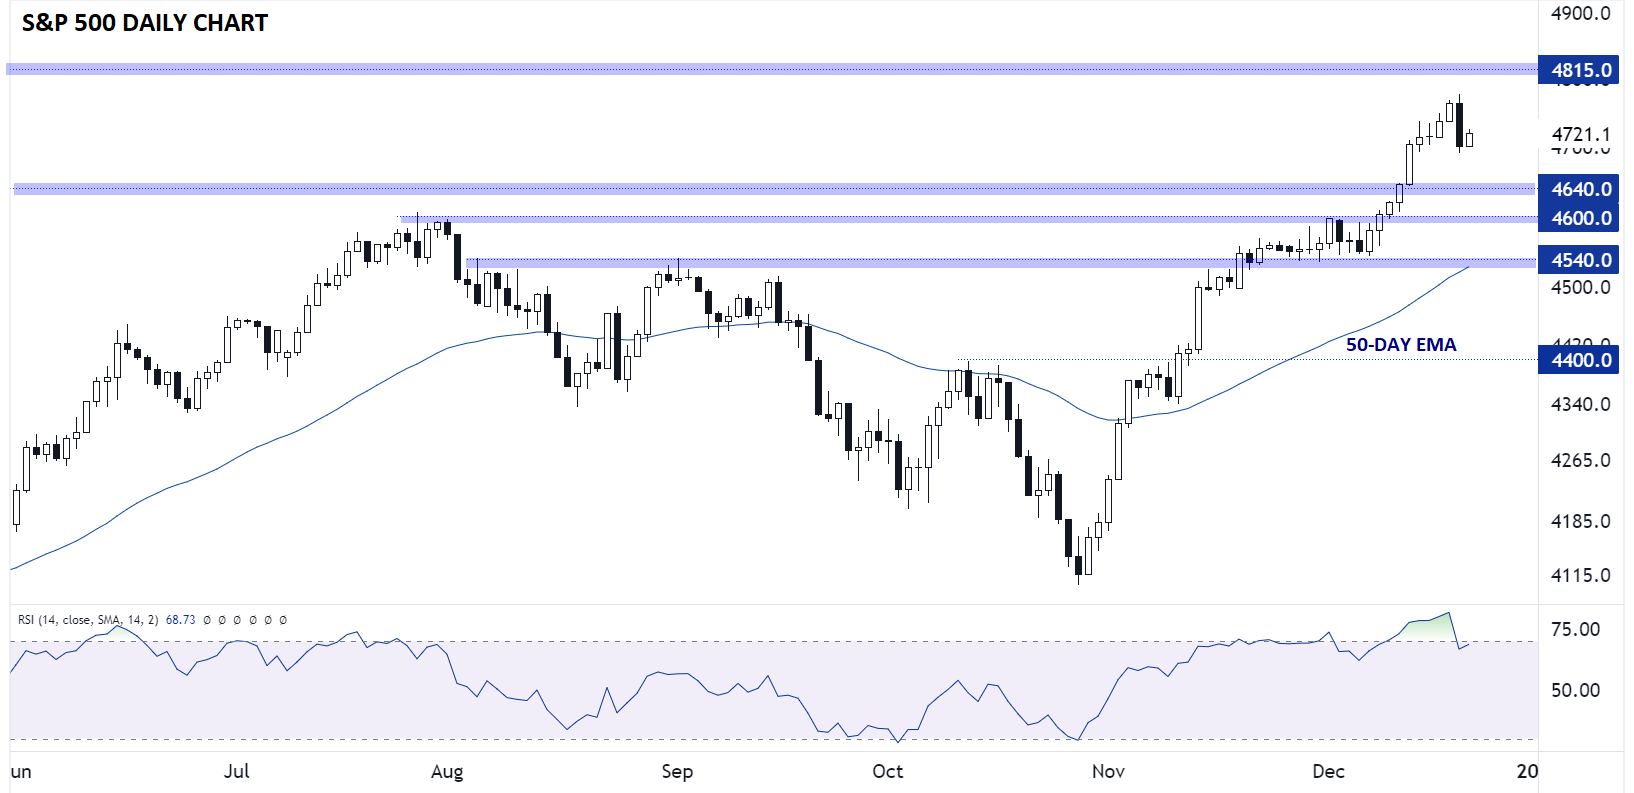
Source: TradingView, StoneX
Relative to the Dow, the outlook for the S&P 500 is incrementally less bullish. So far, the index has failed to hit a record high above 4,815, signaling less conviction on the bulls’ part relative to other US indices. The same bearish engulfing candle and overbought RSI shows potential for a near-term reversal or consolidation, with room down to previous support areas at 4,640, 4,600, and 4,540 if such a move emerges.
On the other hand, if Santa rides to the rescue and pushes the index to fresh record highs at 4,815, it would signal an extension of the recent bullish surge and open the door for a continuation toward 4,900 or 5,000 in the first quarter of 2024.
Nasdaq 100 Technical Analysis – NDX Daily Chart
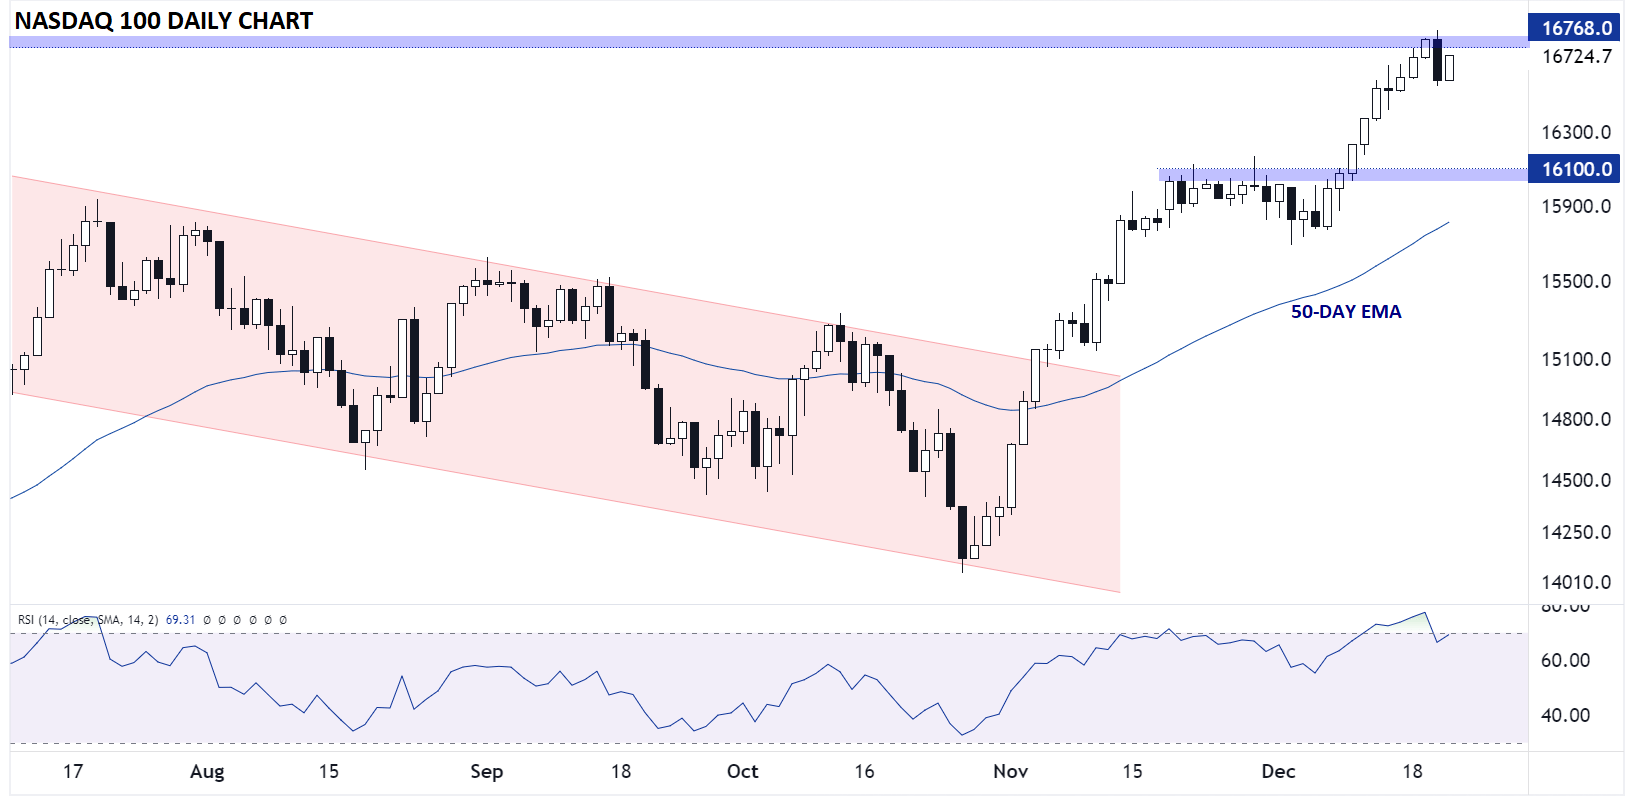
Source: TradingView, StoneX
The tech-focused Nasdaq 100 is a mix of the previous two US indices. NDX did rally to just eclipse its record high at 16,768 earlier this week, but failed to establish a meaningful foothold above that level. Yesterday’s big reversal is accordingly more significant, and bulls will want to see a break and close above yesterday’s high near 16,865 before ringing in the New Year with a big celebration. To the downside, the next logical support level is at 16,100, whereas a break above yesterday’s high could target the round 17K level in short order.
-- Written by Matt Weller, Global Head of Research
Follow Matt on Twitter: @MWellerFX
Latest market news
Yesterday 01:39 PM
Yesterday 01:29 PM
Yesterday 12:16 PM
Yesterday 08:17 AM
Latest DJIA articles

April 25, 2024 03:09 PM

April 14, 2024 04:00 AM

April 12, 2024 05:46 PM

April 11, 2024 01:11 PM