


The rise in yields due to the bond selloff has received much coverage in recent weeks, and any attempt to pick the top in yields has burned many fingers along the way. But when multiple markets provide clues at the same time, it can point towards an inflection point – even if only short lived.
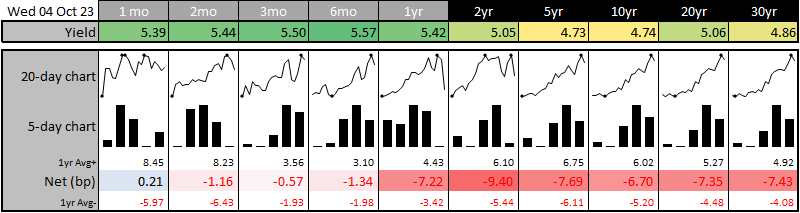
On Wednesday we saw US yields pull back across the curve from multi-year highs, which allowed currencies to drag themselves from their lows along with stock market indices. The bounces were mild and in no means a white flag from bears, and merely a reprieve from the selloff if anything. But perhaps there may be some more juice in the tank for risk if the retracement on the bond markets extends for another day or two.
A measure of implied volatility for bond markets also retraced lower with yields, with the MOVE index for the 30-day, 3-month and 6-month all tracking the VIX lower. The 30-day MOVE index is also on the cup of retreating below the 3-month MOVE, which means implied volatility could soon be expected to be less over the next month than over the next three (and is where we would usually expect to find it). The 30-year yield also failed to hold above 5% on the day, suggesting profit taking from bears who were short the market.
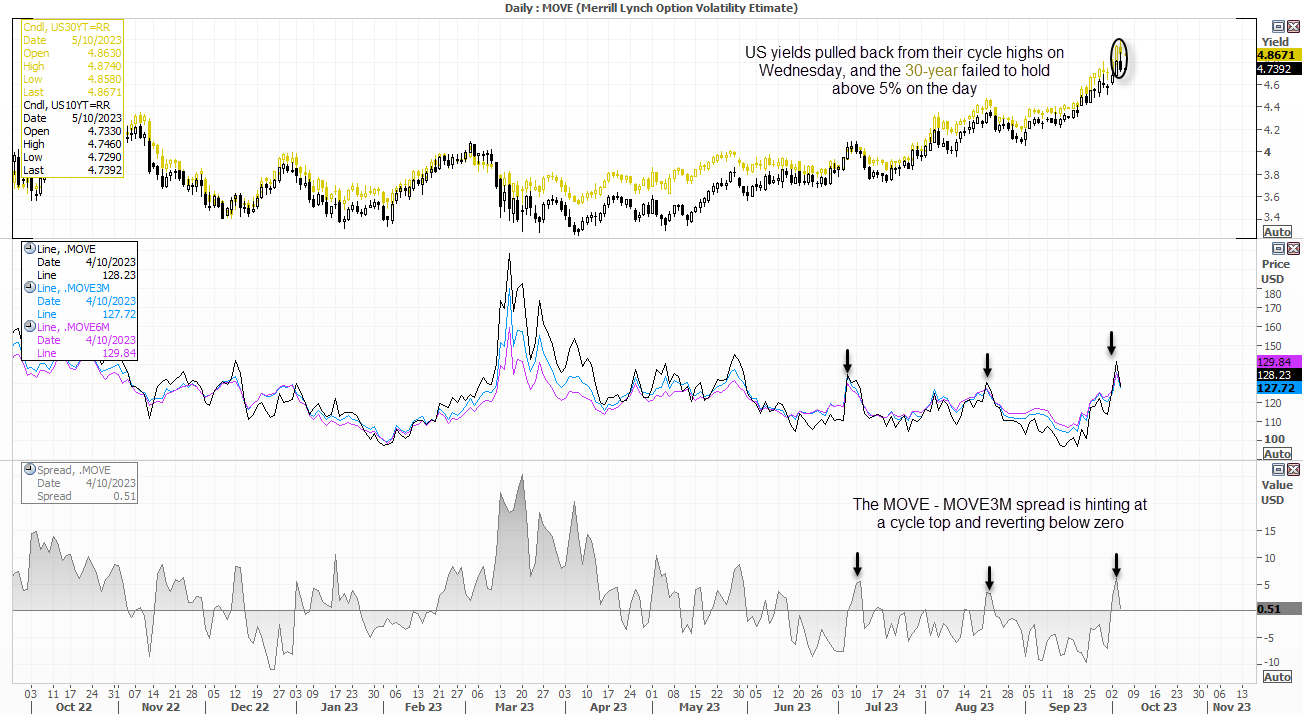
And with near-record level of futures traders net-short bonds, profit taking may not be the worst idea in the world once in a while. This may not be the end of the trend given the increased supply of bonds and ‘higher for longer’ Fed narrative, but we may be at or close to a near-term inflection point that could allow risk to bounce a tad here or there.
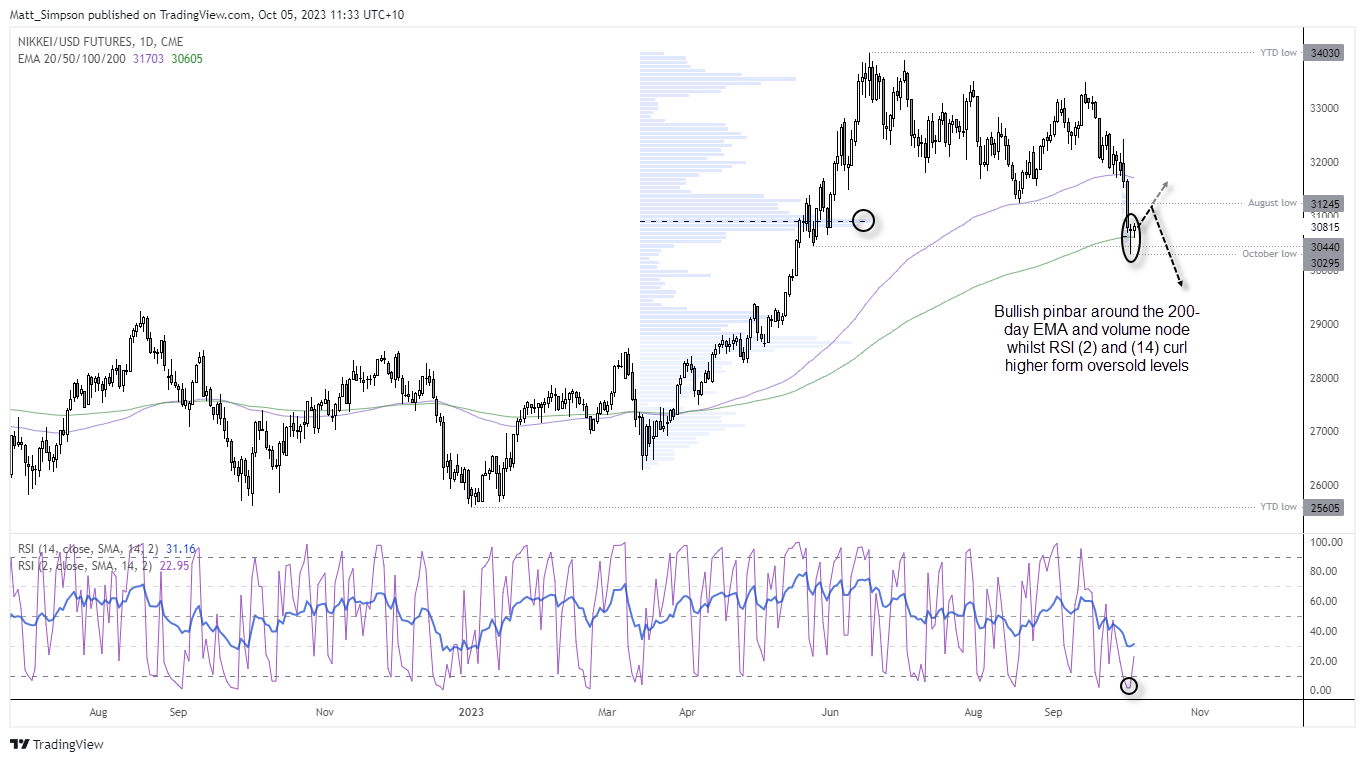
Nikkei 224 futures technical analysis (daily chart)
The Nikkei fell nearly -10% form the September high, before the 200-day EMA came to the rescue. Prices are also trading around a volume ledge left during the March to June rally, so some bulls may be defending these levels. Furthermore, the RSI (2) and RSI (14) reached their respective oversold levels on Tuesday and have since curled higher to hint at a near-term trough, and the market formed a small bullish pinbar on Wednesday.
From here, I’m cautiously bullish whilst prices remain above the 200-day EMA and for a retest of 34,000,
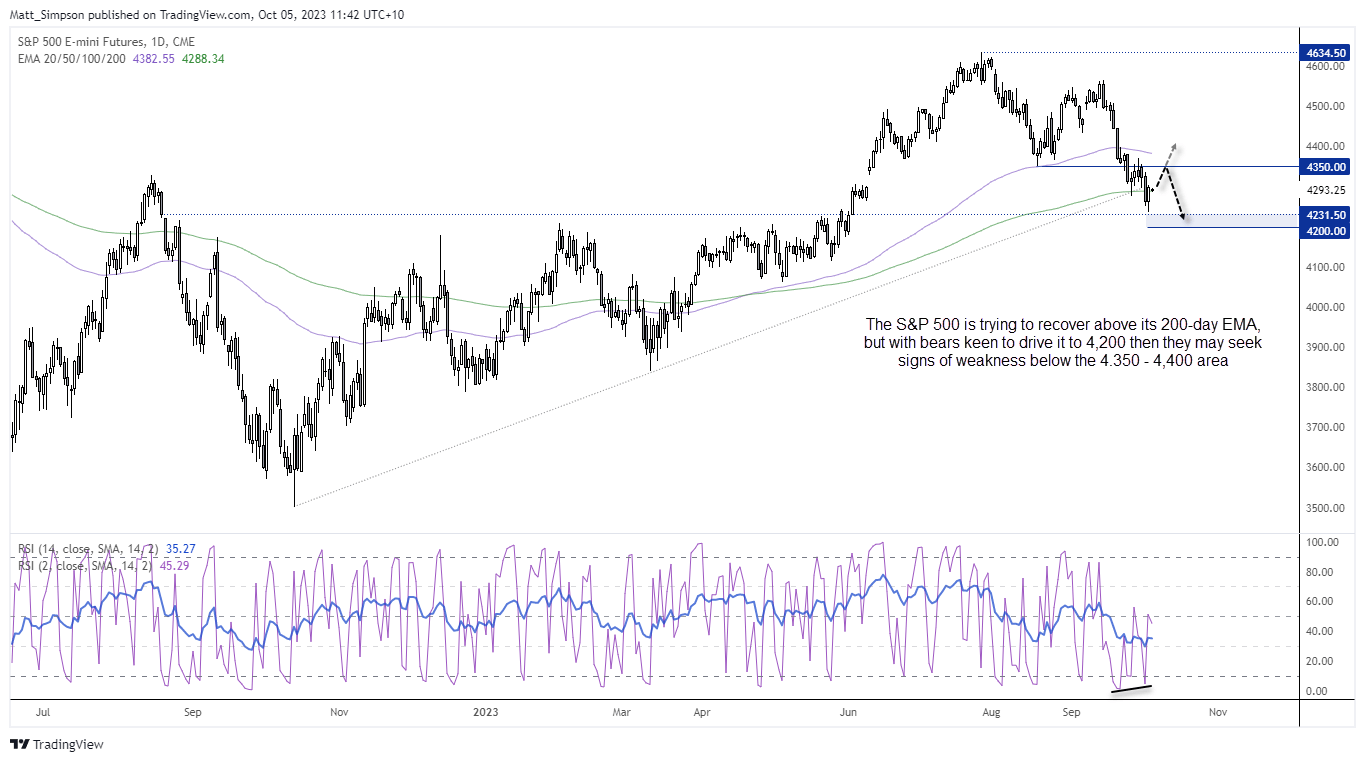
S&P 500 E-mini futures technical analysis (daily chart)
I also see the potential for a bounce on the S&P 500, given it also bounced back above its 200-day EMA. A bullish divergence formed on the RSI (2) and RSI (14) has curled higher from oversold. Wednesday’s lows also held above 4,200, although as of yet we’re yet to see a break above 4,300. The issue I have with this index is the reward to risk seems undesirable being below 4,350 resistance, which is why intraday trade would be preferred until we get more clarity on its next direction. But 4,200 seems like a viable target for bears should yields rip higher, and that could make the 4,350 area tempting for bears to fade into, should we get a small dead-cat bounce.
-- Written by Matt Simpson
Follow Matt on Twitter @cLeverEdge
How to trade with City Index
You can trade with City Index by following these four easy steps:
-
Open an account, or log in if you’re already a customer
• Open an account in the UK
• Open an account in Australia
• Open an account in Singapore
- Search for the market you want to trade in our award-winning platform
- Choose your position and size, and your stop and limit levels
- Place the trade
Latest market news
Today 05:56 AM
Yesterday 11:57 PM
Yesterday 08:00 PM
Yesterday 02:00 PM
Latest Trade Ideas articles

Today 05:56 AM

Yesterday 11:57 PM

Yesterday 08:00 AM
April 26, 2024 11:40 AM