


GBP/USD and US CPI Key Points
- US CPI came in hotter than expected at 0.4% m/m (3.5% y/y), with the “Core” and “Supercore” measures also accelerating.
- Traders are souring on the potential for a June rate cut from the Fed, with the September/November timeframe now looking more likely.
- GBP/USD has fallen to test its 200-day MA under 1.2600, with additional support from a rising trend line near 1.2550.
The biggest economic data release of this week – and arguably the whole month – didn’t disappoint in terms of its market impact.
The just-released US Consumer Price Index (CPI) report for March came in hotter than expected at 0.4% m/m (3.5% y/y). Adding insult to injury, policymakers watch the so-called “Core” (excluding food and energy costs) CPI report closely, and that aspect of the release also came in above expectations at 0.4% m/m (3.8% y/y).
In fact, no matter how you slice the data, it’s hard to argue that inflation is falling. Even the tortured “Supercore” inflation measure that Fed Chairman Jerome Powell has drawn attention to in recent months re-accelerated, with the month-over-month reading coming in at 0.65% and the year-over-year reading shooting up to 4.77%, the hottest print since last April.
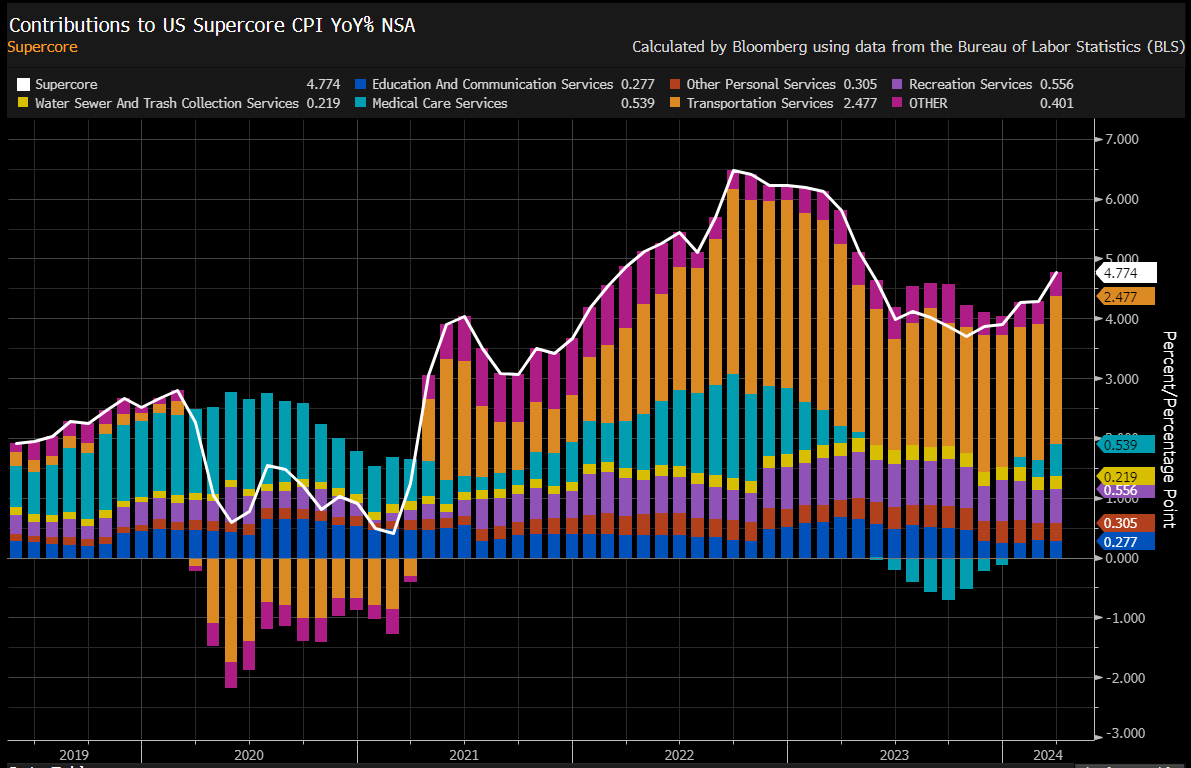
Source: Bloomberg
For a central bank that was looking for any sign that inflation was continuing to fall toward its target, this report will be a big disappointment for the Federal Reserve. Indeed, according to the CME’s FedWatch tool, the market-implied odds of a rate cut in June have cratered from roughly 50/50 before the inflation report to only a 20% likelihood of a rate cut in H1, and the probability of a the first rate cut now only ticks above 50% in September.
Traders’ reaction to the release – and the attendant risk of higher interest rates – was swift. The US Dollar Index surged 80 pips to test the 2024 highs again, major indices immediately fell by -1%+, and the yield on the 2-year Treasury bill gained a staggering 20bps to approach 5% for the first time since November.

British Pound Technical Analysis – GBP/USD Daily Chart
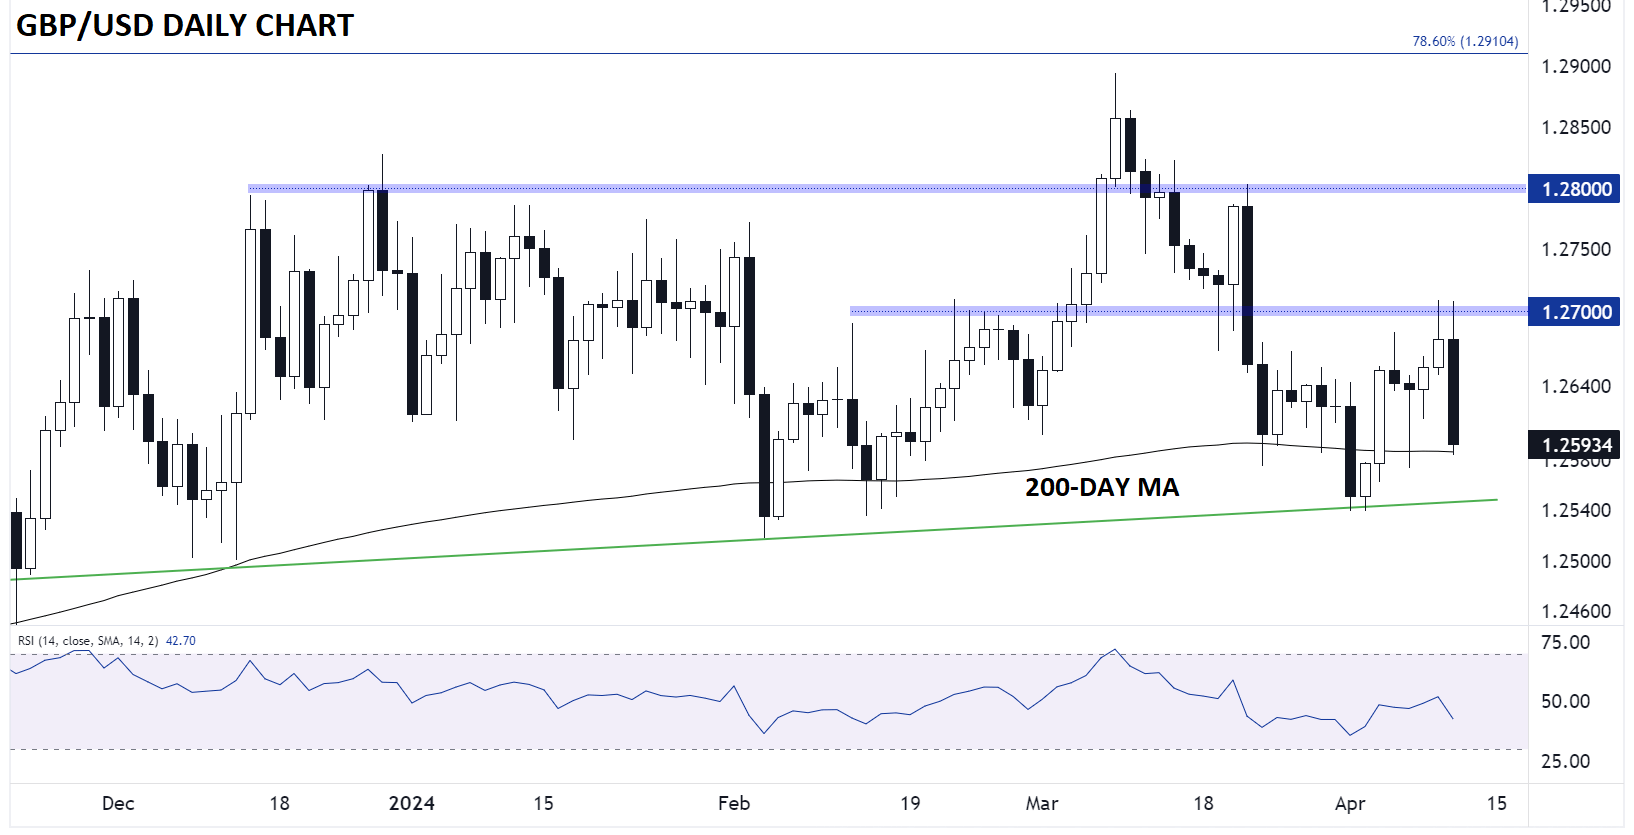
Source: TradingView, StoneX
Keying in on Cable, GBP/USD has seen an aggressive rejection off previous support/resistance at 1.2700 following the CPI release, falling to sub-1.2600 as we go to press. The pair is now testing its 200-day MA once again, a key long-term measure of a market’s trend. Even if the 200-day MA near 1.2590 gives way, the pair could still find resistance near the 5-month bullish trend line around 1.2550.
With little in the way of UK data on tap this week, GBP/USD will likely take its cue off US releases, including Fedspeak and the minutes from the March FOMC meeting later this week. Looking out a big further, traders should also watch tomorrow’s US PPI report and the UK GDP report along with US Consumer Sentiment data on Friday.
-- Written by Matt Weller, Global Head of Research
Follow Matt on Twitter: @MWellerFX
Latest market news
Today 08:15 AM
Yesterday 10:44 PM
Latest Inflation articles
April 24, 2024 03:14 PM

April 19, 2024 06:01 AM
April 12, 2024 03:39 AM

April 10, 2024 01:09 AM