


Asian Indices:
- Australia's ASX 200 index rose by 47.8 points (0.67%) and currently trades at 7,169.40
- Japan's Nikkei 225 index has risen by 47.15 points (0.15%) and currently trades at 31,903.86
- Hong Kong's Hang Seng index has risen by 61.42 points (0.35%) and currently trades at 17,852.43
- China's A50 Index has fallen by -44.47 points (-0.36%) and currently trades at 12,444.62
UK and Europe:
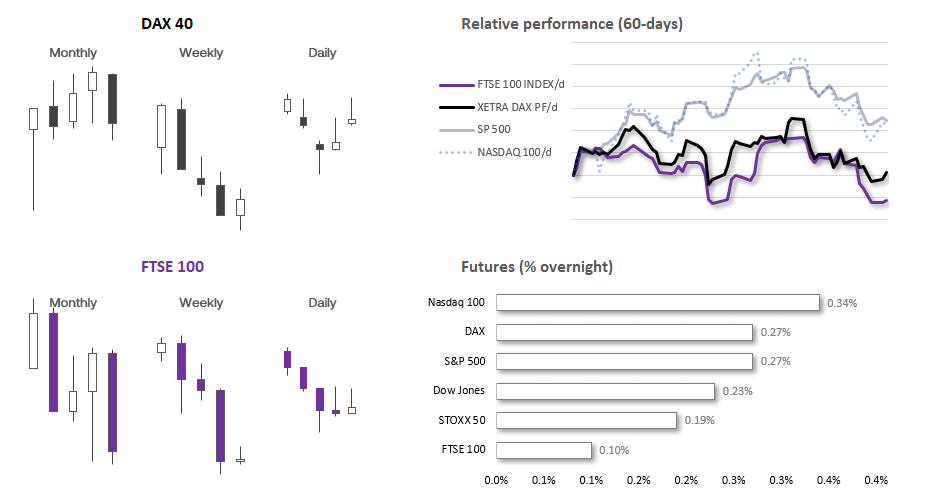
- UK's FTSE 100 futures are currently up 5 points (0.07%), the cash market is currently estimated to open at 7,275.76
- Euro STOXX 50 futures are currently up 5 points (0.12%), the cash market is currently estimated to open at 4,265.37
- Germany's DAX futures are currently up 38 points (0.24%), the cash market is currently estimated to open at 15,743.62
US Futures:
- DJI futures are currently up 73 points (0.21%)
- S&P 500 futures are currently up 10.5 points (0.24%)
- Nasdaq 100 futures are currently up 48.25 points (0.32%)
- Japan’s economy continued to knock out decent figures with flash PMIs being the latest batch to beat estimates. The composite PMI expanded at its fastest pace in four months riven mostly by services, although manufacturing contracted at a slower pace.
- A pickup in new orders and employment with softer inflation levels were noteworthy takeaways, and this points to stronger growth figures going forward.
- This contrasted with Australia’s PMI data which saw the composite and services survey’s fall to a 19-month low although, like Japan, manufacturing contracted at a slower pace.
- And that sets the stage for flash PMI data for France, Germany, Europe, UK and the US today – which should place EUR/USD and GBP/USD for news traders today.
- France kicks off at 08:15 BST, Germany at 08:30, Eurozone at 09:00 and the UK at 09:30. We then have a bit of a gap until US PMIs flash PMIs are then released at 14:45 BST.
- Ranges have been quiet during the breezy Asian session, although expected to pick up with a slew of flash PMI data on the radar.
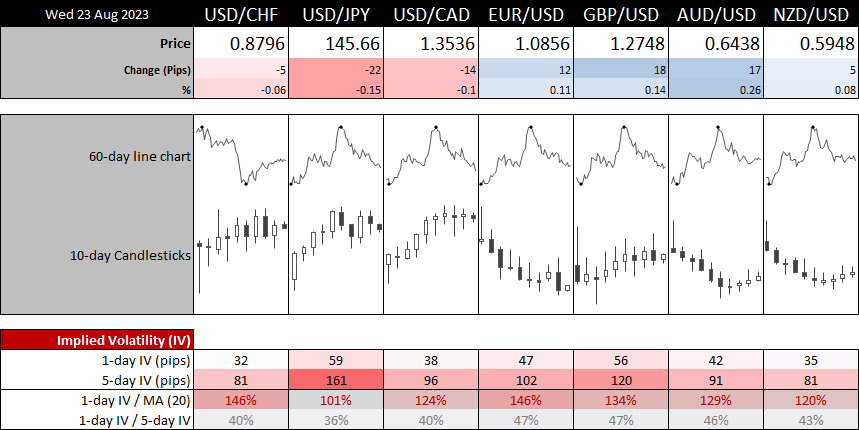
- 1-day implied volatility is above its 20-day average for most FX majors ahead of the BRICS summit, although not by a particularly wide margin and the 1-day remains less than half of the 5-day.
- USD/JPY remains within Monday’s bullish engulfing candle around the midway point, which provides little in the way of clues as to which way it can trade over the next couple of sessions.
- USD/CHF remains as choppy as ever on the daily chart and one I’m happy to avoid for now.
- AUD/USD has risen cautiously higher as it tries to rack up its fourth consecutive bullish day, but take note that yesterday’s bearish hammer perfectly respected the May low as resistance.
- GBP/USD is holding above yesterday’s bearish engulfing low, which met resistance at the 200-week EMA we flagged on Monday. As outlined below, we’d prefer to short EUR/USD over GBP/USD due to price action on EUR/GBP, but GBP/USD does have the potential to eventually break above yesterday’s high if Jerome Powell disappoints hawks at the Jackson Hole.
- Gold has tracked AUD/USD cautiously higher and shows the potential to rise towards 1907 – 1920. But as outlined in an earlier report, if momentum turns lower then the next major support level for spot gold prices is around 1870, as it coincides with gold futures support around 1900.
EUR/GBP technical analysis (daily charts):
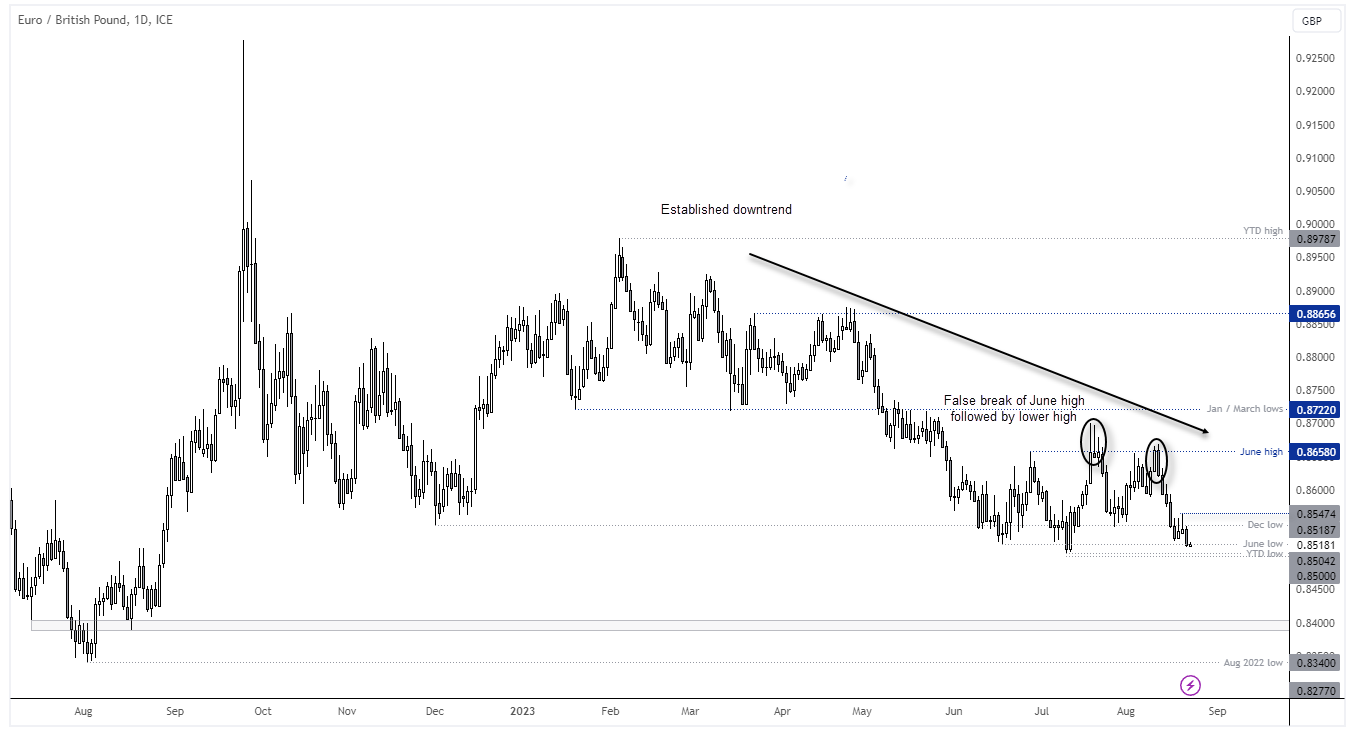
UK data continues to knock it out of the park to revive the potential of (yet) another 50bp BOE hike. Meanwhile, data across the Eurozone is below part. And that helps explain the recent surge of bearish momentum on EUR/GBP and the divergence between the UK and European CESI (City Economic Surprise Index).
If also leaves me favouring a break beneath 0.8500 to a fresh YTD low. The pair is within an established downtrend on the daily chart, and a lower high formed following a false break above the June high. Bearish momentum leading into these lows appears strong, and prices are now less than a day’s trade away from the YTD low after its 2-day retracement higher ended with a bearish pinbar. I suspect a downside break is pending, regardless of whether it is sooner or later. And that also means we’d prefer EUR/USD shorts over GBP/USD shorts (despite the latter failing to break above its 200-dy EMA we warned about on Monday).
EUR/USD technical analysis:
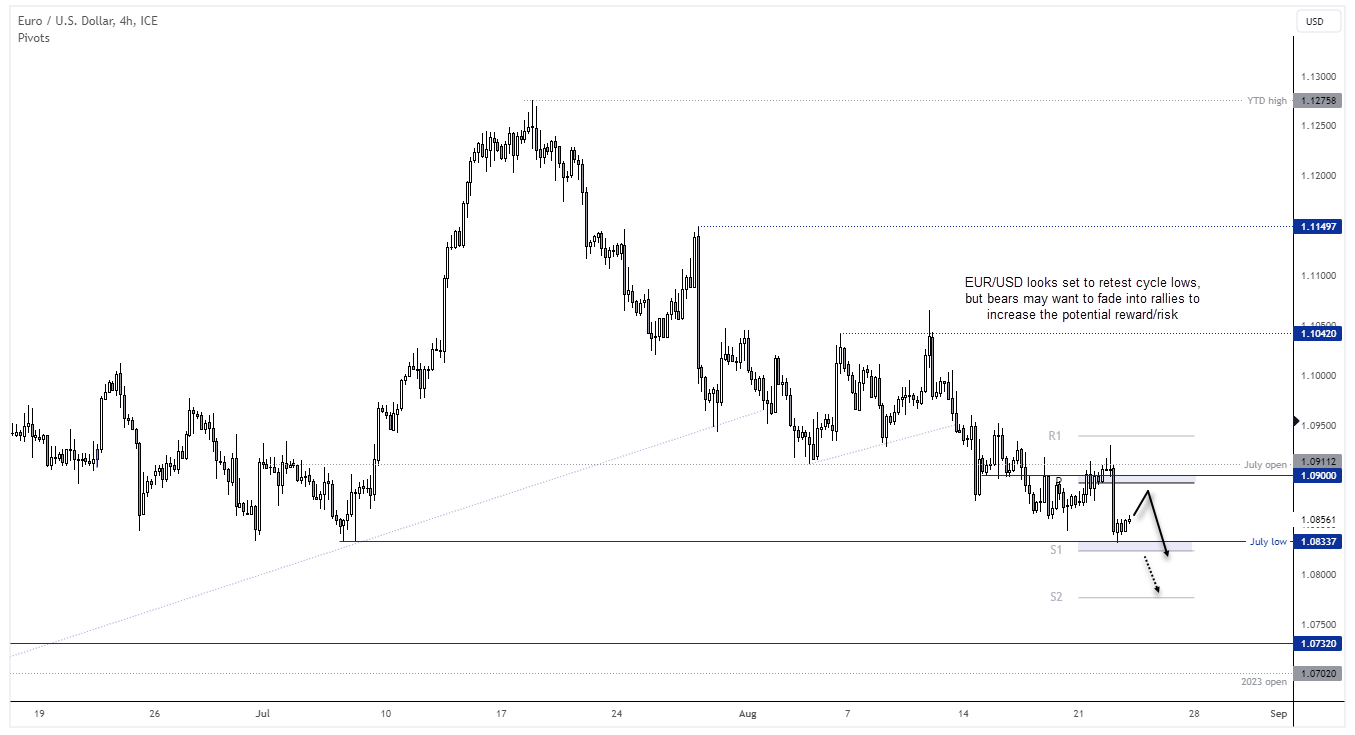
We’re not quite half way through the week yet, but EUR/USD is trying its best to notch up a sixth bearish week. Hawkish comments from Fed’s Barkin and rising yields at the short end of the curve helped EUR/USD probe the July low and formed a bearish engulfing day. And if price action on the DXY and EUR/GBP is anything to go by, a breakdown may arrive sooner than later.
EUR/USD remains within an established downtrend on the 4-hour chart, and momentum accelerated into the lows yesterday. Prices are tentatively drifting higher, although bears may want to wait for prices to move closer to the weekly pivot point before considering shorts to improve the reward to risk ratio above the cycle lows. Alternatively, a break beneath the lower support zone assumes bearish continuation.
View the full economic calendar
-- Written by Matt Simpson
Follow Matt on Twitter @cLeverEdge
How to trade with City Index
You can trade with City Index by following these four easy steps:
-
Open an account, or log in if you’re already a customer
• Open an account in the UK
• Open an account in Australia
• Open an account in Singapore
- Search for the market you want to trade in our award-winning platform
- Choose your position and size, and your stop and limit levels
- Place the trade
Latest market news
Yesterday 06:37 AM
April 26, 2024 01:25 PM
April 26, 2024 11:40 AM
April 25, 2024 03:09 PM
Latest Trade Ideas articles

April 26, 2024 11:40 AM

April 25, 2024 03:00 PM

April 25, 2024 11:14 AM
April 24, 2024 11:00 AM