


A lot has happened in the two months since we outlined a bearish scenario, and they have mostly worked against Tesla and played nicely with our bearish bias.
The company has had to reduce production and slow its hiring as demand in China has fallen below expectations, with COVID and its associated lockdowns not helping either. Yet demand is clearly not living up to expectations in the US either, with a US $3750 incentive offered to customers who take delivery of certain vehicles now, instead of waiting a year for other models.
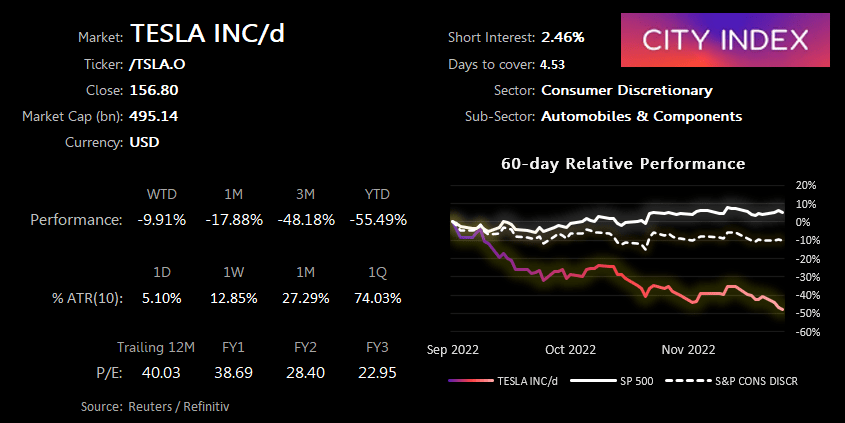
And there’s also the issue with Twitter, where the CEO is seemingly spending much of his time trolling the Twittersphere with his new toy after firing large proportions of its workforce. The prospects of higher interest rates haven’t helped much either, although it is worth noting the stock has fallen a further -5% since the last article compared to the Nasdaq’s 7.5% rise. Tesla is currently trading at 29x its projected earnings which, whilst above the S&P 500’s x17, is the lowest since it went public in 2020. And for the first time in 13-months its market value is now below $500 billion. Let’s see how this has all impacted price action.
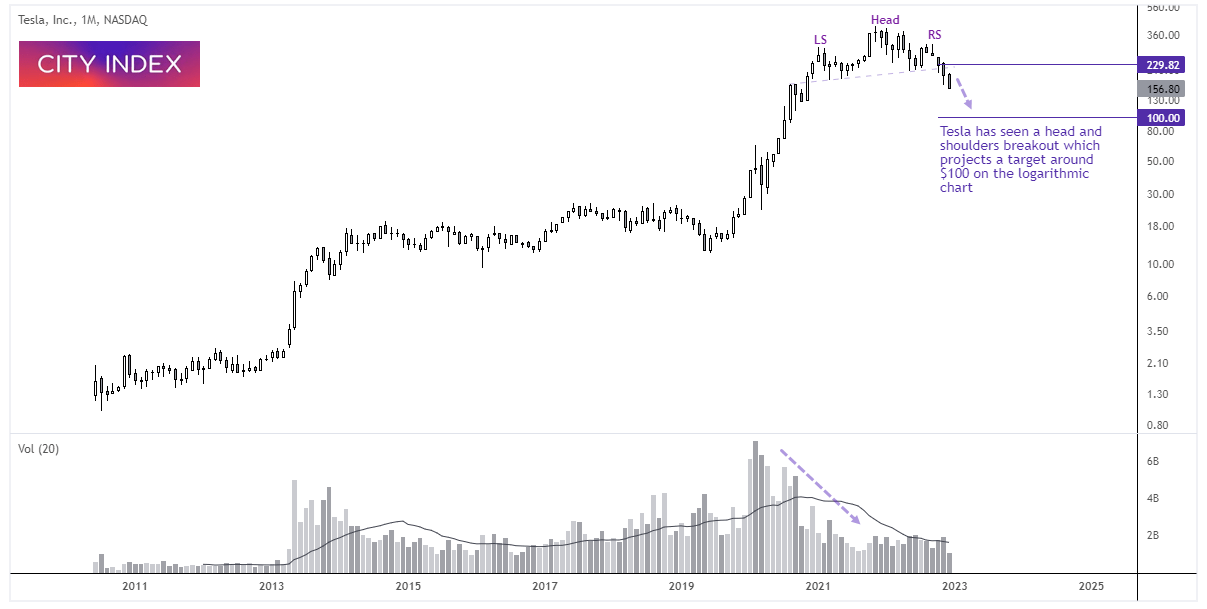
Tesla (TSLA) monthly chart:
Tesla has fallen over 25% since our last article, in which we pointed out the potential head and shoulders reversal pattern, which projects an approximate target around $100 on a logarithmic chart (we use these on long-term charts, especially on markets which have rallied 1000’s of percent). Now sitting at a 25-month low it is approaching the halfway point to the downside target, but we need to keep in mind that monthly charts allow for plenty of volatility within each monthly candle. Also, the stock is within its fifth consecutive month low which is currently a record – which itself leaves us on guard fort some mean reversion along the way.
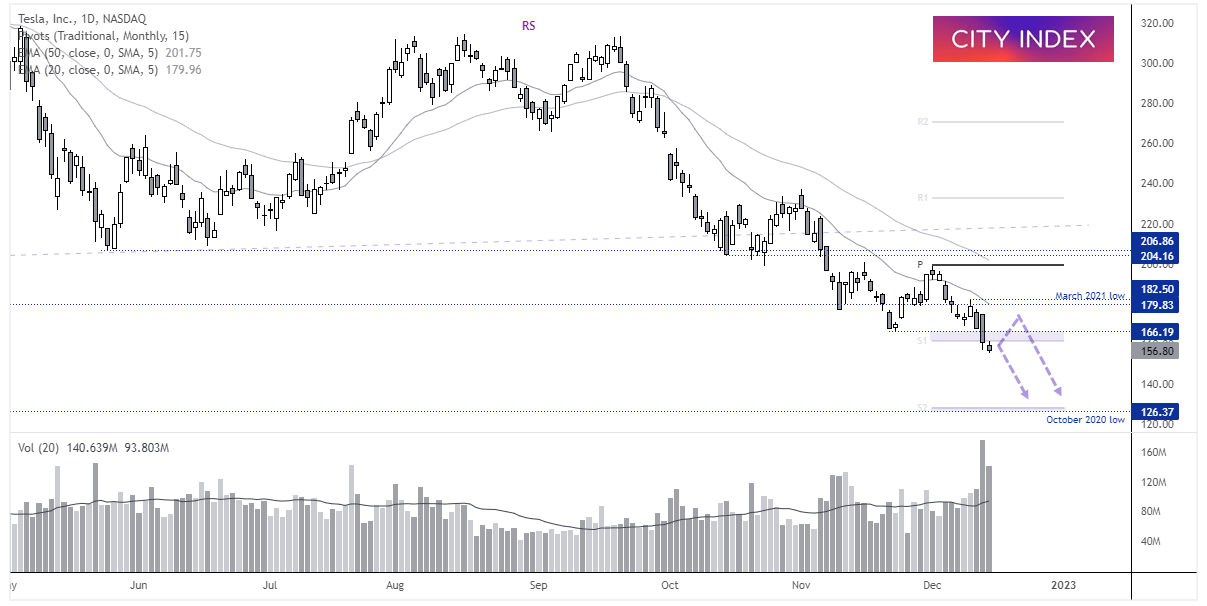
Tesla (TSLA) daily chart:
Whilst the monthly chart is likely to retrace at some point, there are no immediate signs of a trough on the daily charet right now – other than a small bearish candle which suggests bearish momentum is waning at the lows.
- Prices are beneath the monthly R2 pivot and 166.19 low and the near-term bias remains bearish whilst prices remain beneath that zone.
- 140 is a viable interim target, ahead of the October 2020 low near the monthly S pivot point.
- If prices retrace higher then bears could consider fading into low volatility moves below 18 to target 140 and 126.37.
- A break above 200 assumes a deeper retracement is underway, although the bias remains for a move down to $100 on the monthly chart.
Latest market news
April 25, 2024 03:09 PM
April 25, 2024 03:00 PM
April 25, 2024 01:12 PM
Latest Trade Ideas articles


April 25, 2024 03:00 PM

April 25, 2024 11:14 AM
April 24, 2024 11:00 AM