


- China will release retail sales, industrial production, fixed asset investment and Q3 GDP today
- AUD/USD reaction may not be driven by the GDP print
- Australian jobs and inflation data over the next week has grown in importance following hawkish comments during the RBA’s October interest rate meeting.
The tentative rebound in the AUD/USD faces its next hurdle today with the release of China’s monthly ‘data dump’, including Q3 GDP. Given markets continue to equate weak economic data with a greater likelihood of additional stimulus measures, it will be interesting to see whether the Aussie can rally even if the data undershoots expectations.
China GDP unlikely to drive AUD/USD reaction
If there’s been a trend in recent Chinese economic data, it’s that activity seems to be stabilising at what are historically weak levels. Looking at what’s expected today, while the media will be all over the Q3 GDP figure with their coverage, what markets will be paying closer attention too is what the monthly data indicators are portraying.
According to economists polled by Bloomberg, industrial production is seen growing 4.4% from a year earlier, down a tenth on September, while retail sales are seen lifting three tenths to an annual pace of 4.9%. GDP is expected to decelerate to 4.4% from a year earlier, down from 6.3% ion Q2.
Bad is good, good is good?
For AUD/USD, there’s a valid argument it may be supported regardless of how the data prints. If it were to disappoint, it may stoke expectations of further stimulus measures from Chinese policymakers, a point underlined by reports in state media earlier this week discussing another potential reduction to the People’s Bank of China (PBOC) reserve requirement ratio for lenders. Alternatively, should the data beat, it will provide an encouraging picture on China’s growth trajectory, adding to the positive signal from China’s trade data last week which suggested demand for raw materials remained robust in September.
AUD/USD range continues to narrow
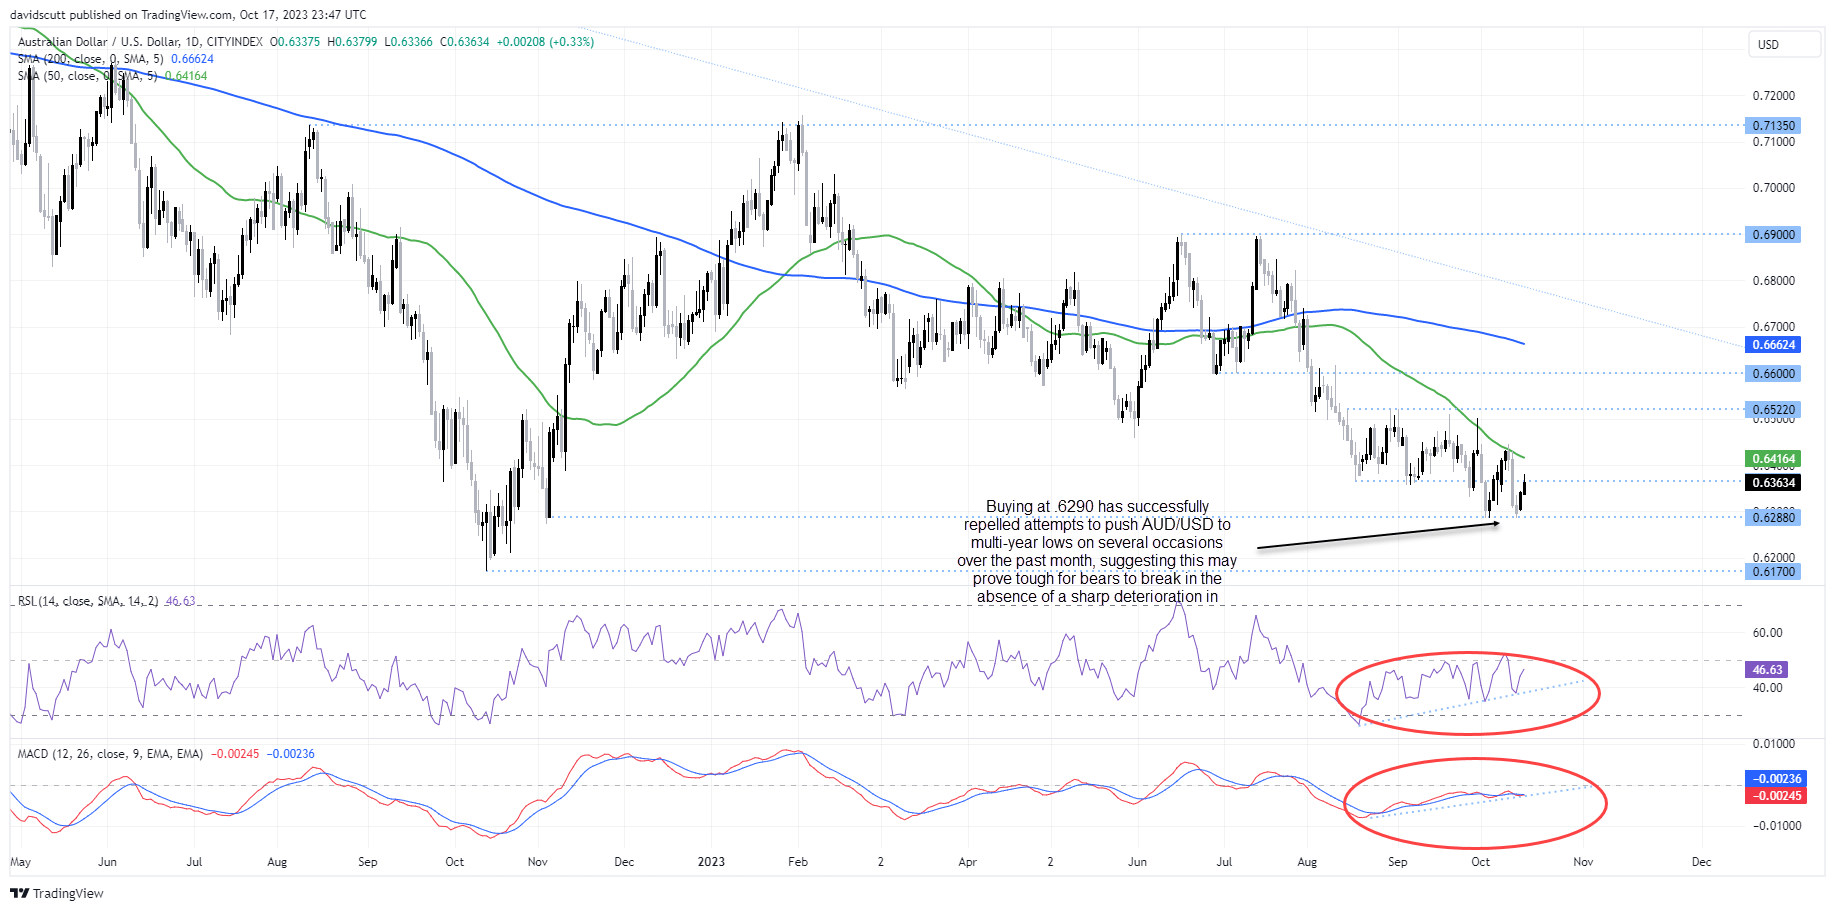
Looking at AUD/USD on the daily, one thing that stands out immediately is the range it’s trading in is becoming increasingly smaller, sandwiched between solid support below .6290 and the 50-day MA, currently located around .6416. Like a coiled spring, the tighter the range becomes, the more it feels like we may see an explosive move either to the downside or upside.
While today’s data is unlikely to deliver such a reaction, it may push the AUD/USD to the extremities of its current range, paving the way for news regarding the Israel-Hamas conflict or Australia’s jobs or CPI report over the next week to perhaps establish a new trajectory heading towards year-end.
On the downside, buyers have successfully repelled attempts to slam the AUD/USD below .6290 on multiple occasions over the past month, hinting this support zone may prove tough to crack in the absence of a significant deterioration in markets or the global growth outlook. In such a scenario, the next downside level to watch would be .6170, the low hit in October last year. On the topside, resistance has been previously seen at .6365, .6520 and again at .6600. Right now, RSI has diverged with recent price action, signaling a loss of downside momentum, while MACD is also trending higher.
-- Written by David Scutt
Follow David on Twitter @scutty
How to trade with City Index
You can trade with City Index by following these four easy steps:
-
Open an account, or log in if you’re already a customer
• Open an account in the UK
• Open an account in Australia
• Open an account in Singapore
- Search for the market you want to trade in our award-winning platform
- Choose your position and size, and your stop and limit levels
- Place the trade
Latest market news
Yesterday 11:57 PM
Yesterday 08:00 PM
Yesterday 02:00 PM
Yesterday 08:00 AM
Latest AUD/USD articles


April 24, 2024 02:03 AM

April 22, 2024 10:40 PM

April 18, 2024 02:40 AM