


Dow, S&P 500, and Nasdaq 100 Key Points
- Major US indices are winding down a tremendous month as interest rates have fallen amidst expectations that the Fed is done raising its policy rate.
- The DJIA, S&P 500, and Nasdaq 100 are all consolidating near multi-month or year-to-date highs.
- Continued consolidation would be seen as a bullish development given the potential for month-end profit taking around the US Core PCE report tomorrow.
After a 3-month losing streak, all three major US indices are on track to close November with their best month in over a year.
Ironically, the clearest catalyst for the move has been deteriorating US economic data, which has in turn convinced traders that the Federal Reserve is done raising its policy rate and led to a broad decline in interest rates across the curve; in addition to lowering interest expenses for companies, lower interest rates make stocks relatively more attractive than bonds, leading to equity market inflows and driving index prices higher.
Below, we highlight the key levels and trends to watch on the three biggest US indices.
Dow Jones Technical Analysis – DJIA Daily Chart
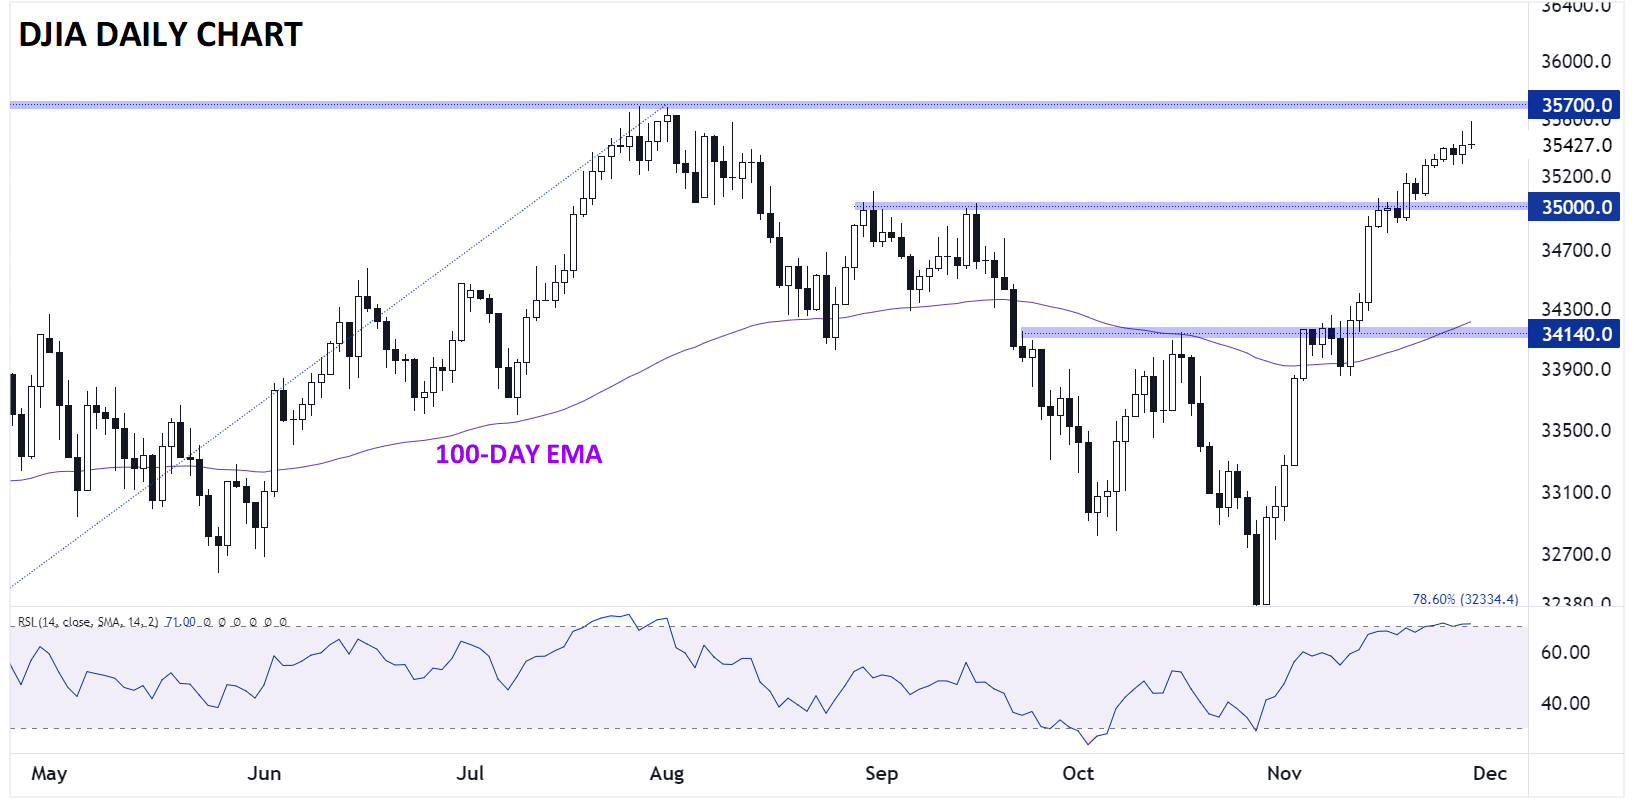
Source: TradingView, StoneX
Since bottoming the day before Halloween, the oldest US index has rallied nearly 10% in a straight line, with only six, small down days in more than four weeks. Now, the Dow Jones Industrial Average is hovering in the mid-35,000s, less than 1% below year-to-date highs and only about 4% from the all-time record high set in early January 2022.
After such an impressive month, bulls are showing signs of losing steam, so a near-term dip appears more likely than not. That said, the longer-term trend will remain to the topside as long as previous resistance at 35,000 holds as support. Looking above current prices, the next resistance zone to watch is the 35,700-800 zone, followed by the record highs at 37,000
S&P 500 Technical Analysis – SPX Daily Chart
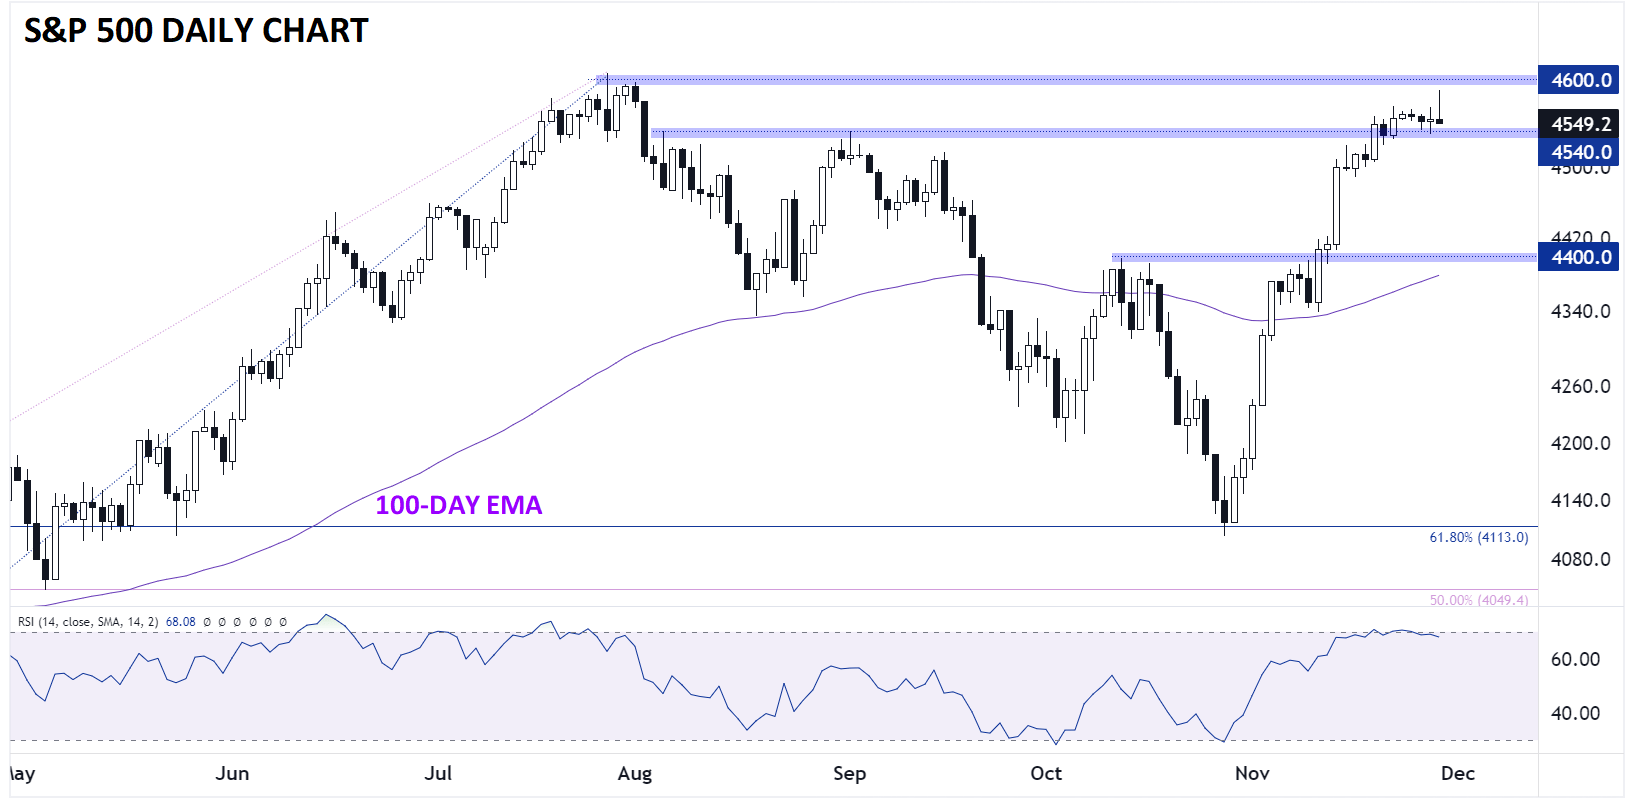
Source: TradingView, StoneX
Looking at the broader S&P 500, the picture is similar. The index has rallied consistently throughout November, taking it to within striking distance of the 2024 highs around 4600. Encouragingly for the bulls, the index has held above its previous multi-month high at 4540, signalling acceptance on the part of traders and opening the door for another leg higher. As long as that level holds, the bullish bias remains intact for a move up toward resistance at 4600 or 4635 next.
Nasdaq 100 Technical Analysis – NDX Daily Chart
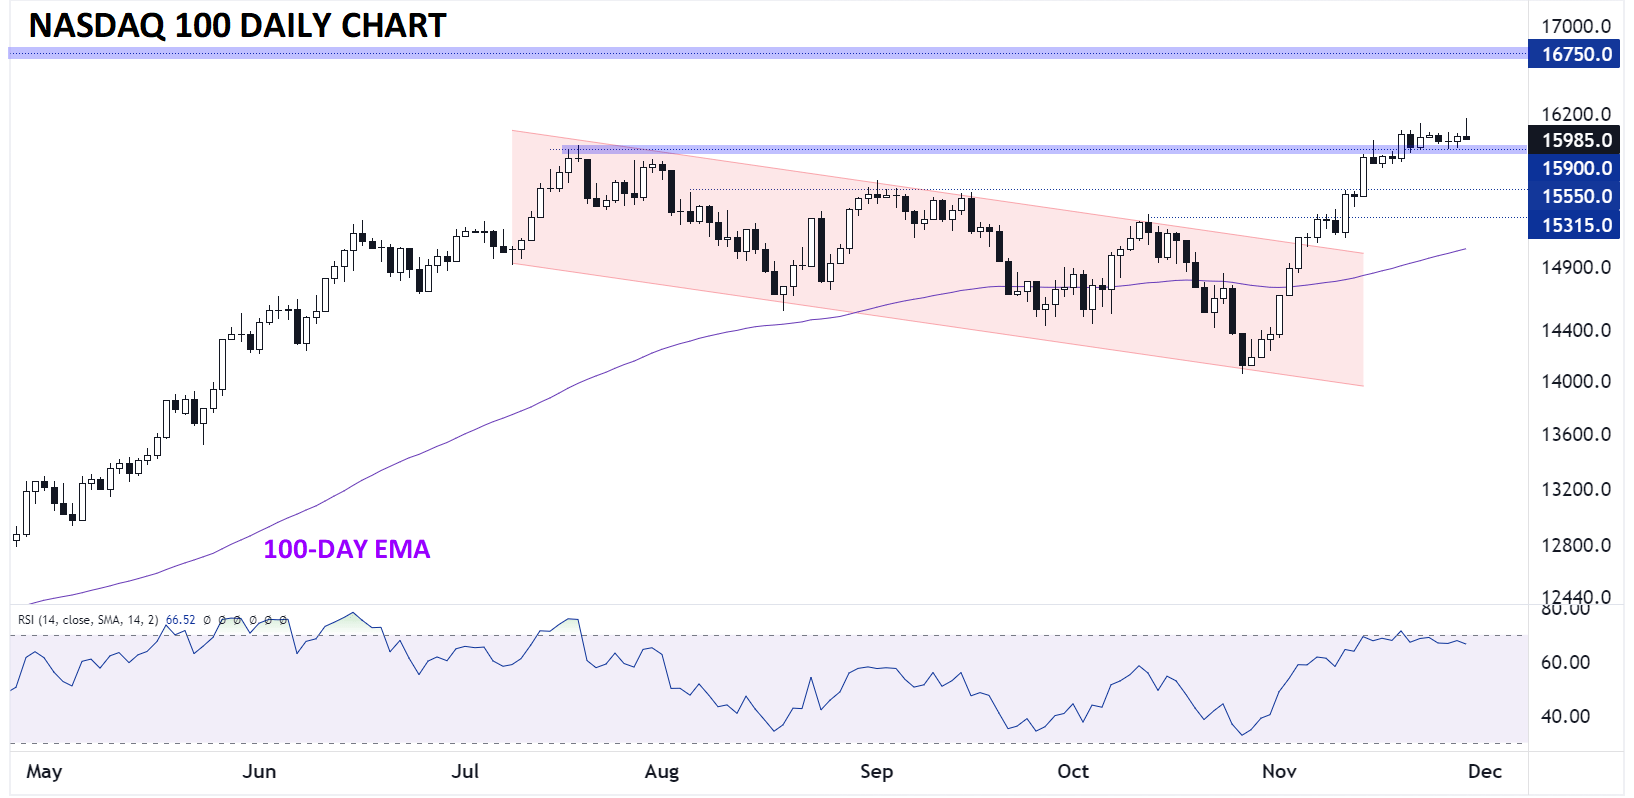
Source: TradingView, StoneX
The tech-focused Nasdaq 100 has been by far the strongest US index all year long. As the above chart shows, NDX broke out to a fresh 2023 high earlier this month and is now consolidating near 16,000. Much like with the S&P 500, the sideways consolidation at the highs has given prices a chance to correct through time, rather than through price, and the longer the Nasdaq 100 holds above 15,900, the more likely a bullish continuation toward the record highs near 16,750 becomes.
“No news is good news” as they say, and if US indices continue to consolidate around current levels, we could be looking at a situation where “no price action is good price action.”
-- Written by Matt Weller, Global Head of Research
Follow Matt on Twitter: @MWellerFX
Latest market news
Yesterday 01:32 PM
Yesterday 09:35 AM
Yesterday 07:23 AM
Yesterday 04:48 AM
Yesterday 12:17 AM
July 25, 2024 10:39 PM
Latest Dow Jones articles

July 18, 2024 11:14 PM

July 17, 2024 04:24 PM
July 16, 2024 09:49 PM

July 15, 2024 01:39 PM