


With all the attention being on the US inflation data on Wednesday, the FX markets are all over the place. Today we will get technical on the USD/JPY and EUR/USD outlook and provide analysis on the FTSE and DAX outlook.
Dollar all over the place ahead of US CPI
The US dollar traded mixed in the first half of today’s session. Against the antipodean dollars and the euro, it strengthened. However, the greenback fell against all other major currencies, most notably the pound and franc, with the cable climbing above 1.29 handle and Swissy falling to its weakest point since January 2021. The USD/JPY fell further to close in on the 140 handle.
The greenback’s overall weakness suggests investors are possibly expecting to see a weaker-than-expected CPI report on Wednesday and, in any case, a 25 bps rate hike is now fully priced in.
The inflation report is expected to show that consumer prices cooled to 3.1% annual pace in June. The actual reading will need to be substantially below 3% for the odds of a 25-bps hike to fall meaningfully from the current level of around 95%.
Anyway, let’s see what the charts are telling us…
USD/JPY outlook: Watch 140 for possible bounce
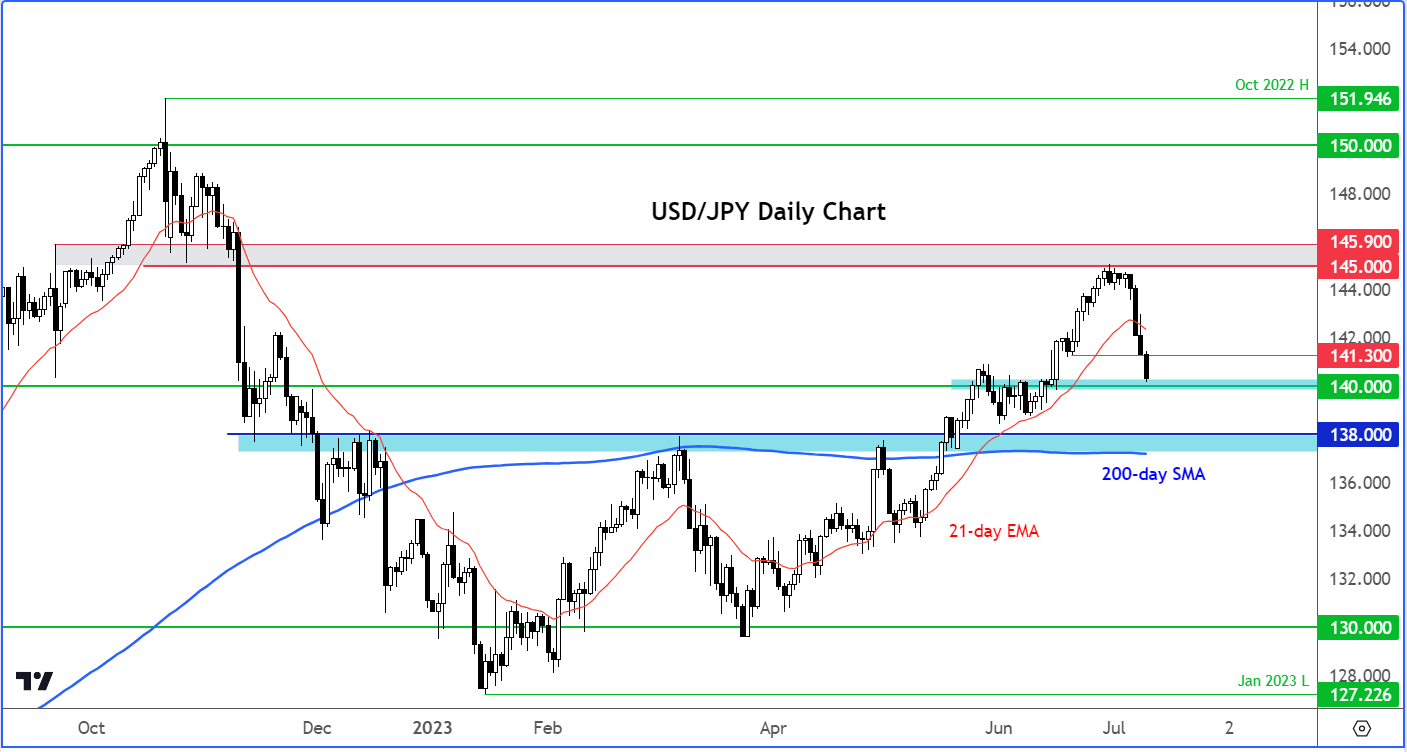
The USD/JPY is the one pair we could see the dollar’ shine to come through should inflation data come out around expectations. The Japanese yen has been among the weakest of major currencies this year until its comeback in the last few days. But without a change in monetary policy stance from the Bank of Japan, we could see this latest USD/JPY dip being bought again.
From a technical point of view, the key level to watch is around 140.00 where the USD/JPY previously broke out from following a lengthy consolidation phase. We would look for a clear bullish reversal pattern to form here first, before turning decisively bullish on the USD/JPY outlook again.
However, a convincing break below 140.00 handle would be probably pave the way for a run down to 138.00 and possibly lower. US CPI would have to be quite weak for that to happen, you would think.
EUR/USD outlook: struggling to get past 1.10 again
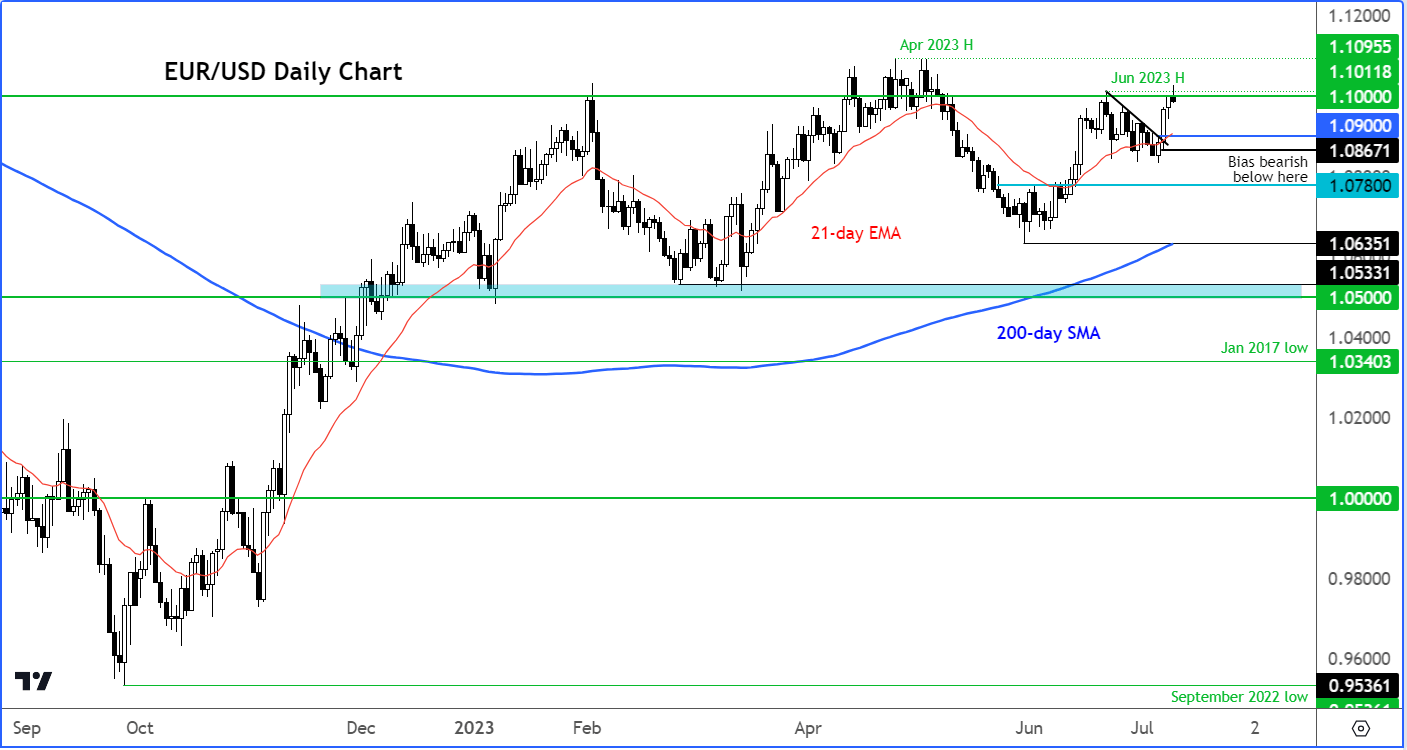
On Friday, the EUR/USD broke its short-term trend line, but it has since not gained much further ground. The lack of follow through means there is a risk that this could put the bulls in a spot of bother. Still, the bears will be in need of some confirmation before potentially punishing this pair. That could come in the form of price potentially going back below Friday’s low at 1.0867. IF that were to happen, then we will have a clear bearish signal to work with.
For now, the path of least resistance is still technically to the upside, but I remain doubtful as to whether we will get any further upside traction without the help of a fresh macro stimulus e.g., US CPI.
So, watch out for a potential reversal here to turn the EUR/USD outlook bearish.
FTSE outlook: Can UK index form a base here?
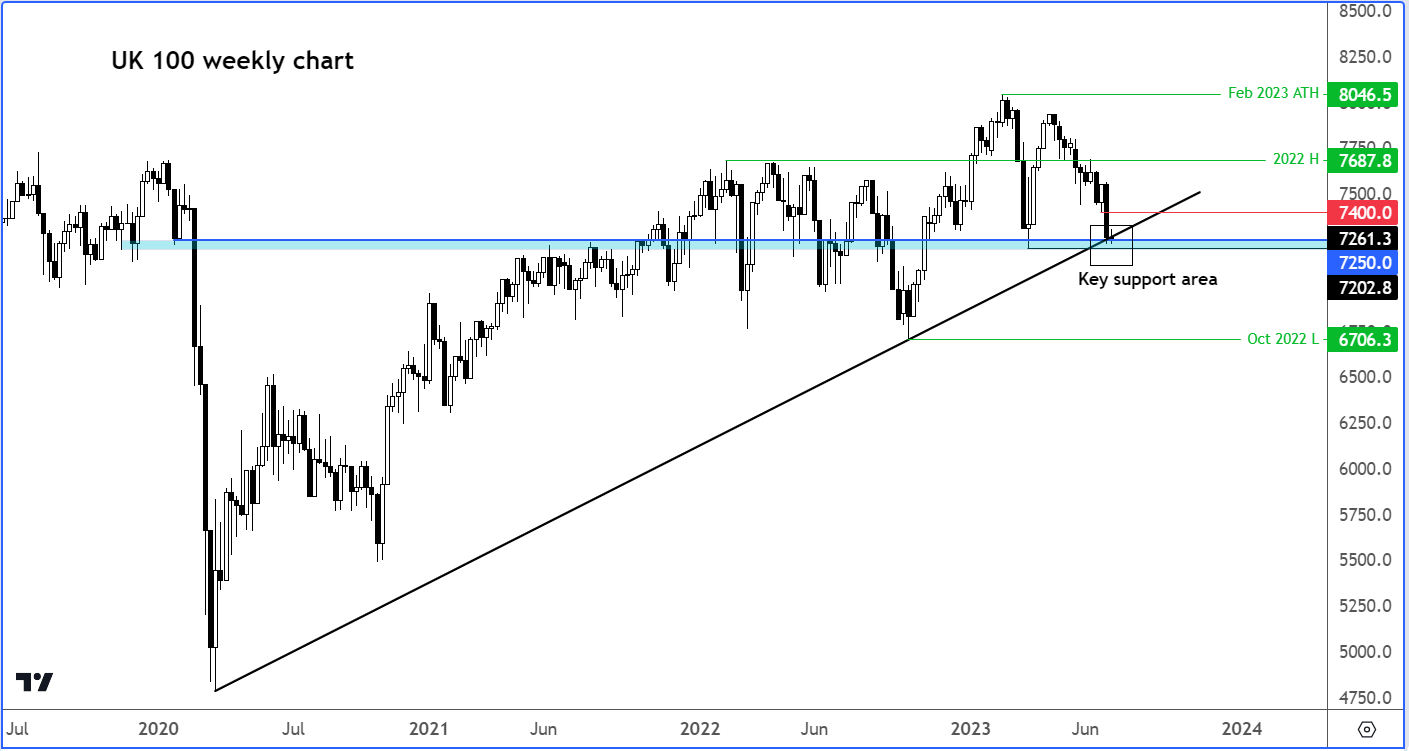
The FTSE was testing key support around 7200-7250, an area where the index bounced strongly from back in March and where a long-term bullish trend line, derived from connecting the low points of 2020 and 2022, comes into play. With the index hitting a record high only a few months ago, there’s no doubt that the long-term trend is bullish. The only question is whether the recovery will start around these levels, or we will get a deeper retracement first. We are on the lookout for a hammer candle, or another similar bullish formation, to form here on the daily time frame, as early as today. If seen, that would be the indication we will be looking for to tell us that the bullish trend had resumed. For now, we are cautiously optimistic on the FTSE outlook.
DAX outlook: German index consolidates inside falling wedge
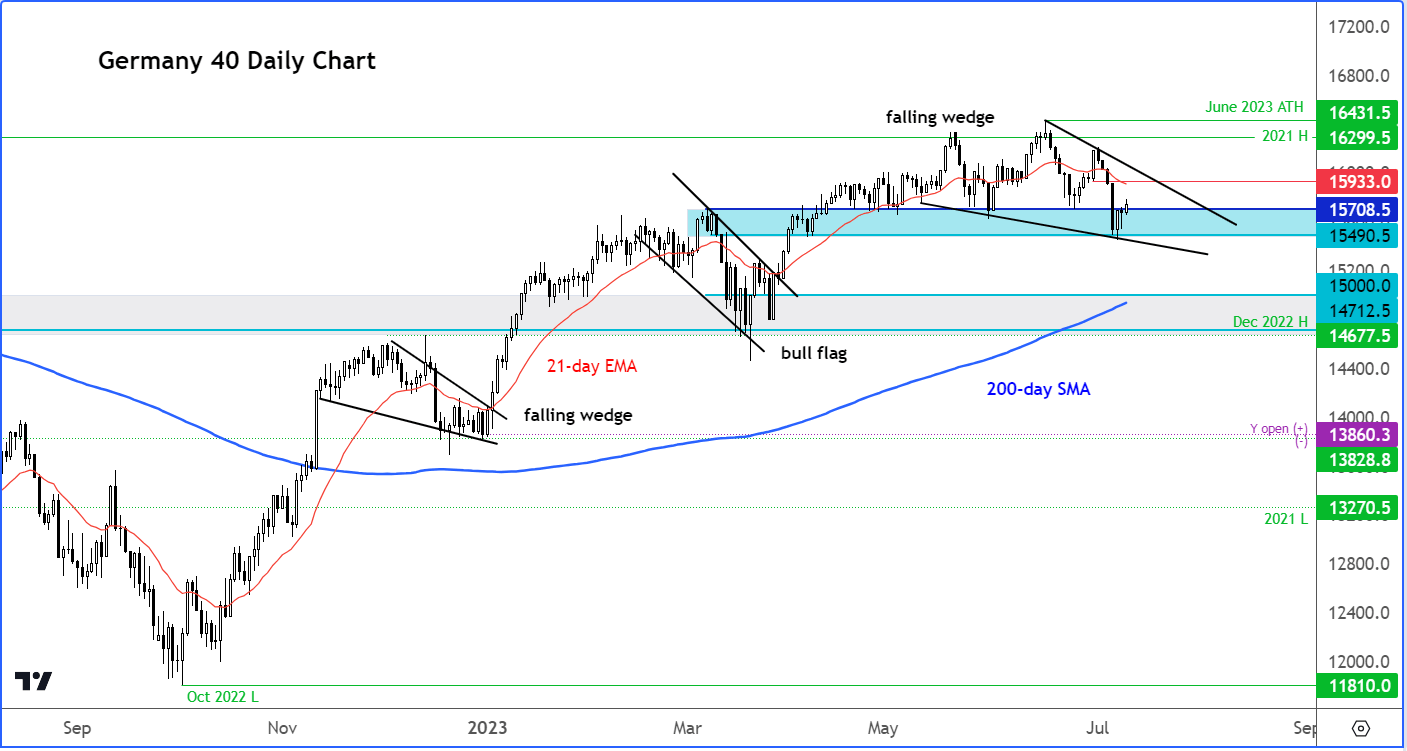
The German DAX index printed a hammer a small hammer on the daily chart on Monday to suggest the recent weakness might have come to at least a temporary halt. The index remains inside a bullish continuation pattern called falling wedge. At some point, it will need to break out of this formation for confirmation. The bulls will be happy for as long as it holds support in the 15500 to 15700 range. Lose this, and we could see a deeper pullback, possibly towards 15000 next. Short-term resistance is seen around 15930ish. For now, the long-term bullish DAX outlook remains valid.
Source for all charts in this article: TradingVIew.com
-- Written by Fawad Razaqzada, Market Analyst
Follow Fawad on Twitter @Trader_F_R
How to trade with City Index
You can trade with City Index by following these four easy steps:
-
Open an account, or log in if you’re already a customer
• Open an account in the UK
• Open an account in Australia
• Open an account in Singapore
- Search for the company you want to trade in our award-winning platform
- Choose your position and size, and your stop and limit levels
- Place the trade
Technical analysis FAQs
What is technical analysis?
Technical analysis is a method used to evaluate financial markets using historical price data to identify trends and patterns. The theory is that previous trading activity can give insight into future price movements.
Learn more about technical analysis
How do I get the latest USD/JPY news?
You can get the latest USD/JPY news and price movements from our in-house team of experts.
Head to our news and analysis section for the most recent updates. Alternatively, you can access a live Reuters newsfeed on our trading platform.
How do you analyse DXY?
You analyse the US dollar index (DXY) in the same way you would a currency pair or stock index. The key difference is it’s not just one currency against another, but the dollar against six others. So, if the dollar is expected to decline against one – but not all – of the currencies, the DXY may not move.
Learn more about the dollar index
What does it mean if DXY goes up?
If the US dollar index (DXY) goes up, it means that the US dollar is gaining in value compared to a basket of other global currencies. Alternatively, if the DXY falls, it means the dollar has lost strength in comparison to other currencies.
See our guide to the US dollar
What is the best indicator for GBP/USD?
Technical analysis of the British pound against the US dollar (GBP/USD) is commonly based on indicators such as moving averages and oscillators. These give traders insights into the direction and strength of trends and areas of support and resistance.
Discover the most popular technical indicators
Latest market news
Yesterday 08:00 PM
Yesterday 08:00 AM
Yesterday 02:00 AM
May 3, 2024 01:03 PM
May 3, 2024 12:52 PM
May 3, 2024 12:11 PM
Latest Technical Tuesday articles

April 23, 2024 04:00 PM

April 16, 2024 04:54 PM

April 9, 2024 11:30 AM

April 2, 2024 04:00 PM