


Gold Holds Above $1,900 After Tuesday's selloff, What's next move?
Following Tuesday's selloff, Spot gold rebounded from an intraday low at $1,863 before closing higher at $1,915. In fact, the weakening of U.S. dollars helped the rebound of gold. The ICE U.S. Dollar Index retreated 0.3% on day to 93.42.
Besides, the vitality of gold jumped to 21.5%, the highest level since April. Investors should expect choppy trading in coming weeks. Currently, the investors would weigh on the dollars, bond yield and the risk appetite for the movement of gold.
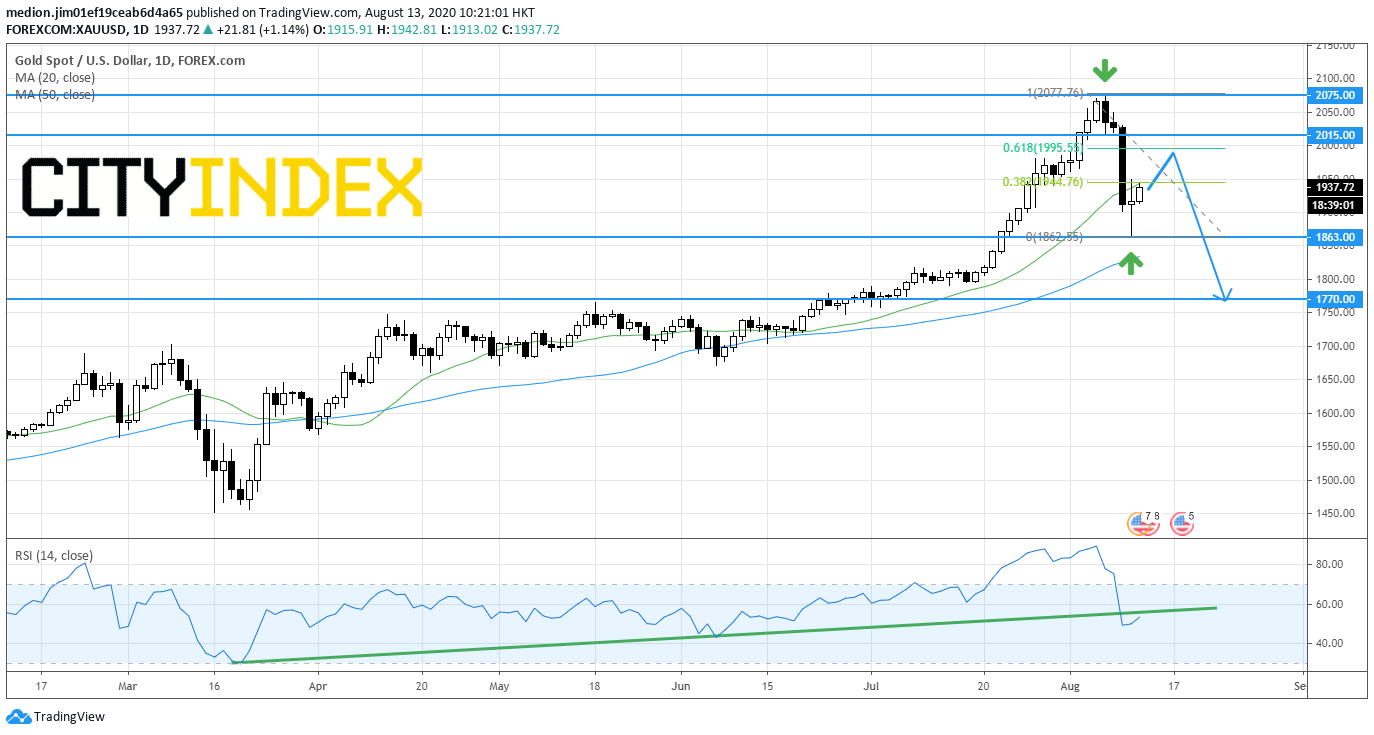
Gold (Short Term): Key Resistance level at $2,015
Source: GAIN Capital, TradingView
On a daily chart, the candlestick pattern showed a Long Ranging Doji, a potential reversal pattern, after sinking to $1,863.
In fact, the technical rebound cannot be ruled out, if gold prices break above yesterday's high at $1,950.
However, unless the resistance level at $2,015 (the day low of the bearish Engulfing bar) is violated, gold prices should remain in the phase of consolidation. The support levels would be located $1,863 and $1.770.
On the other hand, a break above $2,015 would turn the technical outlook to positive and bring a re-visit of next resistance level at $2,075.
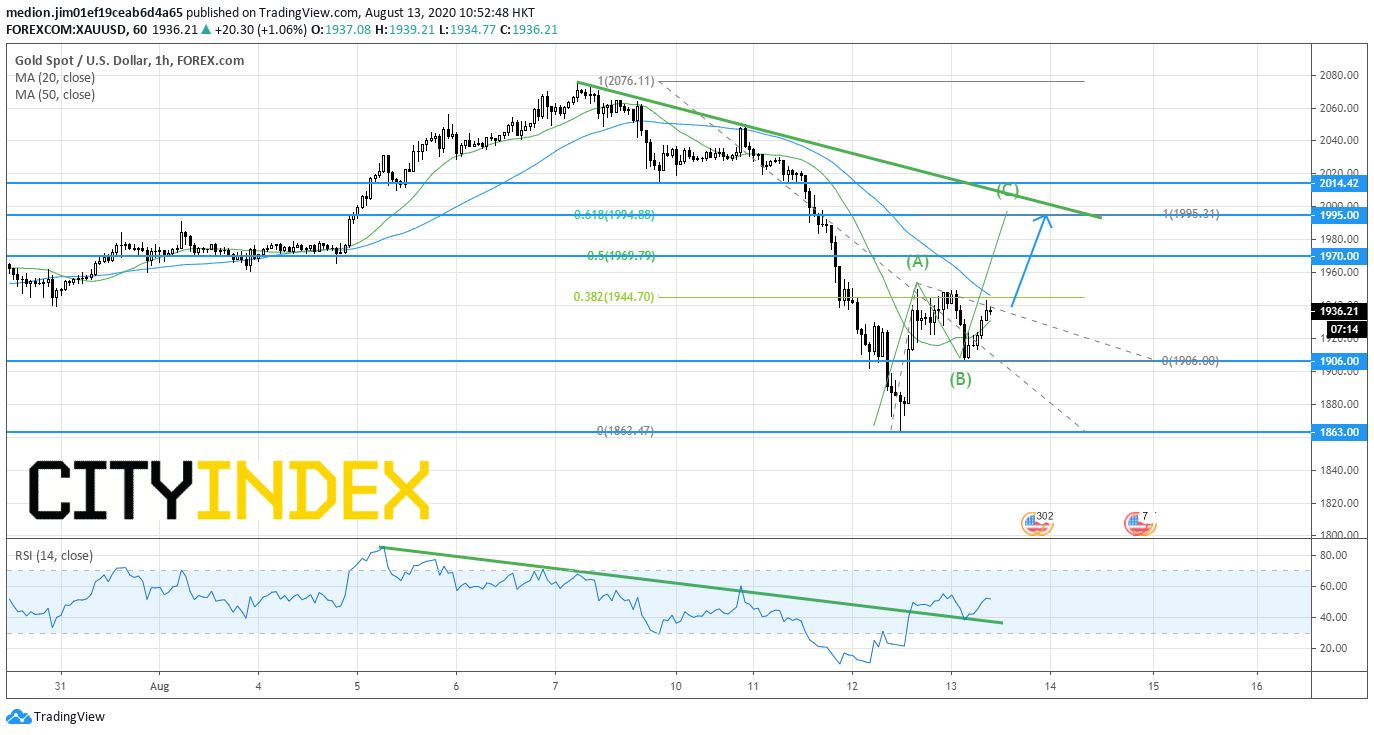
Gold (Intraday): Rebound Expected
Source: GAIN Capital, TradingView
On a 1 hour chart, gold posted another rebound from $1,906 and returned the level above the 20-period moving average. Besides, the 20-period moving average is turning upward.
The relative strength index also breaks above the declining trend line drawn from August 5.
Readers could set the support level at the previous low at $1,906, while resistance levels would be located at $1,970 (50% fibonacci retracement) and $1,995 (61.8% Fibonacci retracement). Investors should focus on the resistance level at $1,995 as it is the level of ABC corrective wave as well. After that, the next resistance level would be located at $2,015.
In an alternative scenario, a break below $1,906 would trigger a return to the support level at $1,863.
Besides, the vitality of gold jumped to 21.5%, the highest level since April. Investors should expect choppy trading in coming weeks. Currently, the investors would weigh on the dollars, bond yield and the risk appetite for the movement of gold.
Gold (Short Term): Key Resistance level at $2,015
Source: GAIN Capital, TradingView
On a daily chart, the candlestick pattern showed a Long Ranging Doji, a potential reversal pattern, after sinking to $1,863.
In fact, the technical rebound cannot be ruled out, if gold prices break above yesterday's high at $1,950.
However, unless the resistance level at $2,015 (the day low of the bearish Engulfing bar) is violated, gold prices should remain in the phase of consolidation. The support levels would be located $1,863 and $1.770.
On the other hand, a break above $2,015 would turn the technical outlook to positive and bring a re-visit of next resistance level at $2,075.
Gold (Intraday): Rebound Expected
Source: GAIN Capital, TradingView
On a 1 hour chart, gold posted another rebound from $1,906 and returned the level above the 20-period moving average. Besides, the 20-period moving average is turning upward.
The relative strength index also breaks above the declining trend line drawn from August 5.
Readers could set the support level at the previous low at $1,906, while resistance levels would be located at $1,970 (50% fibonacci retracement) and $1,995 (61.8% Fibonacci retracement). Investors should focus on the resistance level at $1,995 as it is the level of ABC corrective wave as well. After that, the next resistance level would be located at $2,015.
In an alternative scenario, a break below $1,906 would trigger a return to the support level at $1,863.
Latest market news
Today 01:39 PM
Today 11:05 AM
Today 10:46 AM
Today 05:56 AM
Latest Commodities articles

Today 11:05 AM


Yesterday 11:57 PM

April 22, 2024 03:42 AM