


CPI Takeaways
- The September US CPI report will be released at 8:30 ET on Thursday, October 12.
- Economists expect CPI to print at 0.3% m/m (3.6% y/y), with the core rate at 0.3% m/m (4.2% y/y)
- Despite its fierce rally, the technical bias in gold remains to the downside ahead of the inflation report.
When is the US CPI Report?
The US CPI report for September will be released at 8:30 ET on Thursday, October 12.
US CPI Expectations
Traders and economists expect the US CPI report for September to come in at 0.3% month-over-month (3.6% year-over-year), with the Core CPI expected at 0.3% m/m (4.1% y/y).
US CPI Preview
For most US consumers, gasoline prices are by far the most visible, visceral way they experience inflation. On that front, the September CPI report is unlikely to bring additional pain, though any immediate relief is unlikely. Despite oil prices surging to new year-to-date highs last month, gas prices remained essentially flat after jumping by more than 10% the previous month. Another flashpoint for US consumers is food prices, which may have seen recent price gains tick lower to around 3.6% last month.
Of course, Jerome Powell and the rest of the Federal Reserve is more focused on ex-food and -energy “core” measures of inflation, and on that front too, some relief is likely with economists expecting a seventh consecutive decline down to 4.1% y/y. For what it’s worth, the Fed’s “Super-Core” (service prices excluding rent) measure has essentially fallen to the central bank’s target, averaging just 2.2% growth over the last 3 months.
Taking a step back, the Fed has indicated that its future interest rate decisions will be “data dependent,” so this week’s inflation report certainly has the potential to lead to a big market reaction. That said, recent comments from the central bank have suggested that the recent surge in interest rates make a November rate hike unlikely. Accordingly, the market-implied odds of a such a move next month have fallen to just 16%, and a soft inflation report this week may put the proverbial “nail in the coffin” for any immediate interest rate changes:
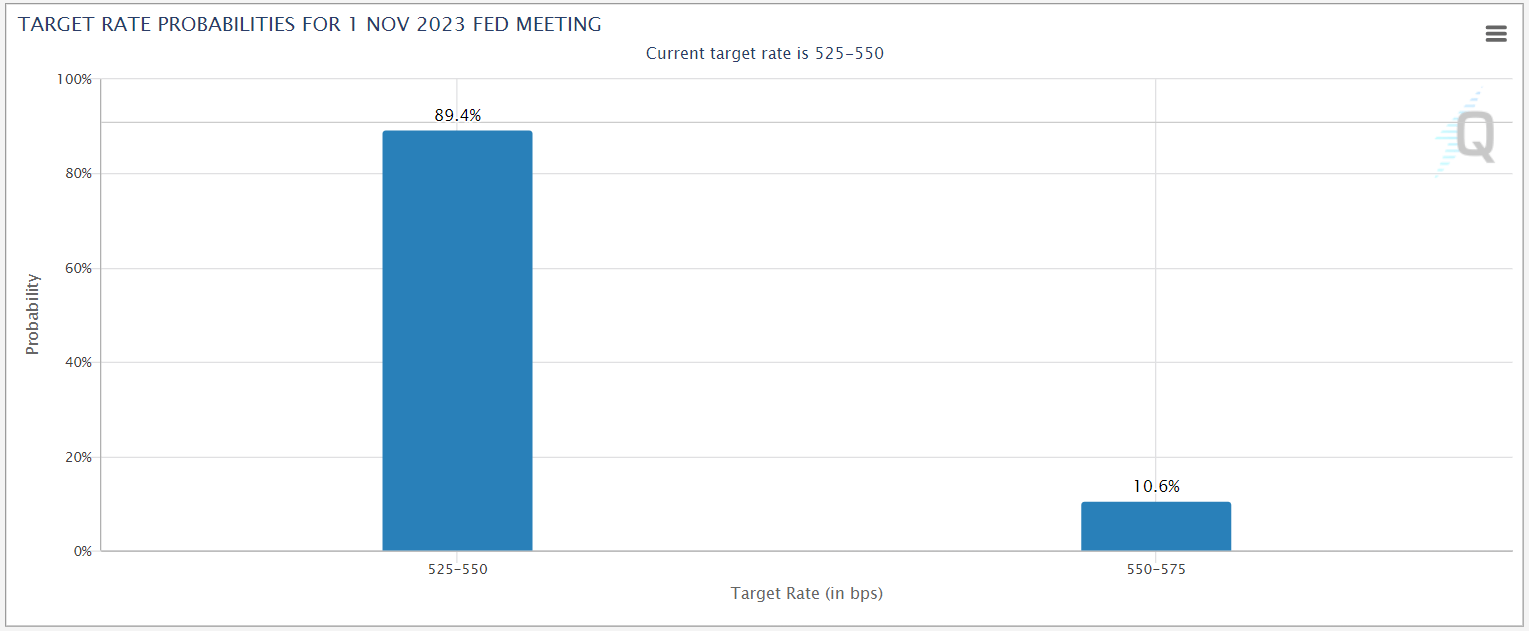
Source: CME FedWatch
Gold Technical Analysis – Gold Daily Chart
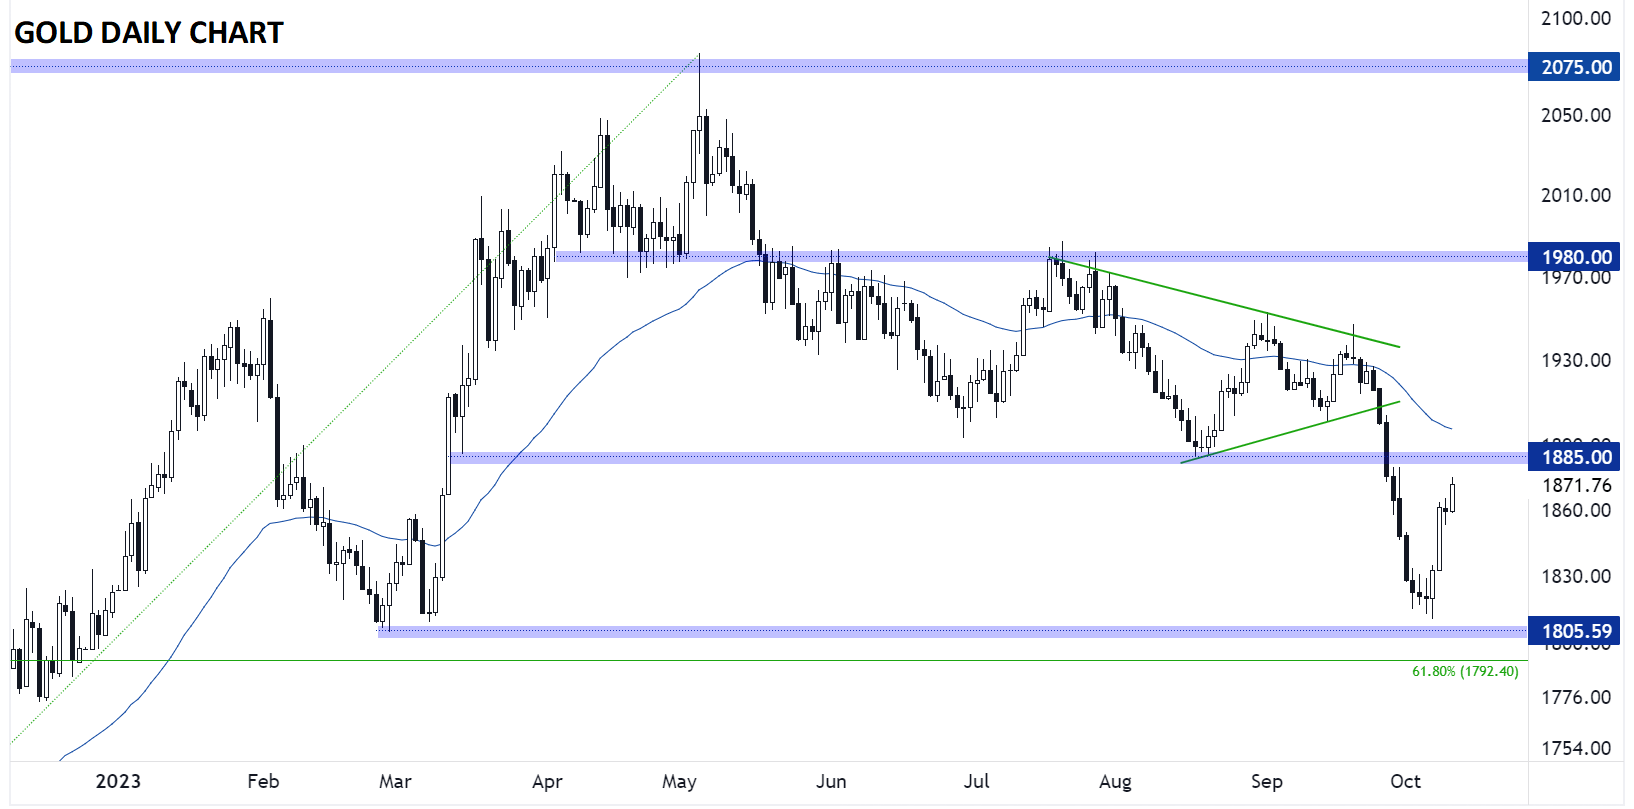
Source: TradingView, StoneX
Turning our attention to a particularly inflation-sensitive asset, gold has seen an impressive rally over the last week or so. After falling for nine consecutive days, gold has surged more than 3% off last week’s lows to trade back above $1870 as we go to press.
From a technical perspective, gold remains below previous-support-turned-resistance near $1885, and as long as that level caps prices, the short-term bias will remain lower (the recent sharp rally notwithstanding). Only a move back above $1900 or so would flip the medium-term bias back in favor of the bulls.
-- Written by Matt Weller, Global Head of Research
Follow Matt on Twitter: @MWellerFX
Latest market news
Yesterday 01:32 PM
Yesterday 09:35 AM
Yesterday 07:23 AM
Yesterday 04:48 AM
Yesterday 12:17 AM
July 25, 2024 10:39 PM
Latest Gold articles

July 22, 2024 02:47 AM

July 15, 2024 01:00 AM

July 9, 2024 02:32 AM

July 4, 2024 02:30 PM