


EUR/USD rises despite German PPI falling
- German PPI fell -6% YoY, vs 0.1% previously
- USD pauses for breath after strong gains last week
- EUR/USD trades below its multi-week falling trendline
EUR/USD is inching higher at the start of the new week towards 1.09, after falling 0.7% across last week, its fifth straight weekly loss.
The upside in the pair could be capped amid a cautious market mood and after German PPI came in much lower than expected.
German PPI fell 6% YoY in July after rising 0.1% in June. This was below forecasts of -5.1%. On a monthly basis, PPI fell-1.1% after falling 0.3% MoM in June. This was weaker than the -0.2% fall forecast.
The data points to a continued decline in consumer price inflation. However, it also raises concerns over the demand picture in Germany. The weak demand environment has weighed on producers sending prices lower and rises worries over a prolonged recession in the region, potentially limiting the upside in EUR.
Meanwhile, the USD is edging lower after strong gains last week. The USD index rose for a fifth straight week last week, boosted by bets that the Federal Reserve will keep interest rates higher for longer after upbeat retail sales data and hawkish FOMC minutes. The USD was also lifted by safe-haven flows amid concerns over the health of the Chinese economy.
The market mood remains cautious after China’s PBoC cut rates by a smaller margin than expected, which could support the Dollar.
Looking ahead, the Jack Hole Symposium, which begins on Friday, will be the key event this week for the pair. Fed Chair Powell’s comments could set US rate expectations and the path for EUR/USD.
EUR/USD outlook -technical analysis
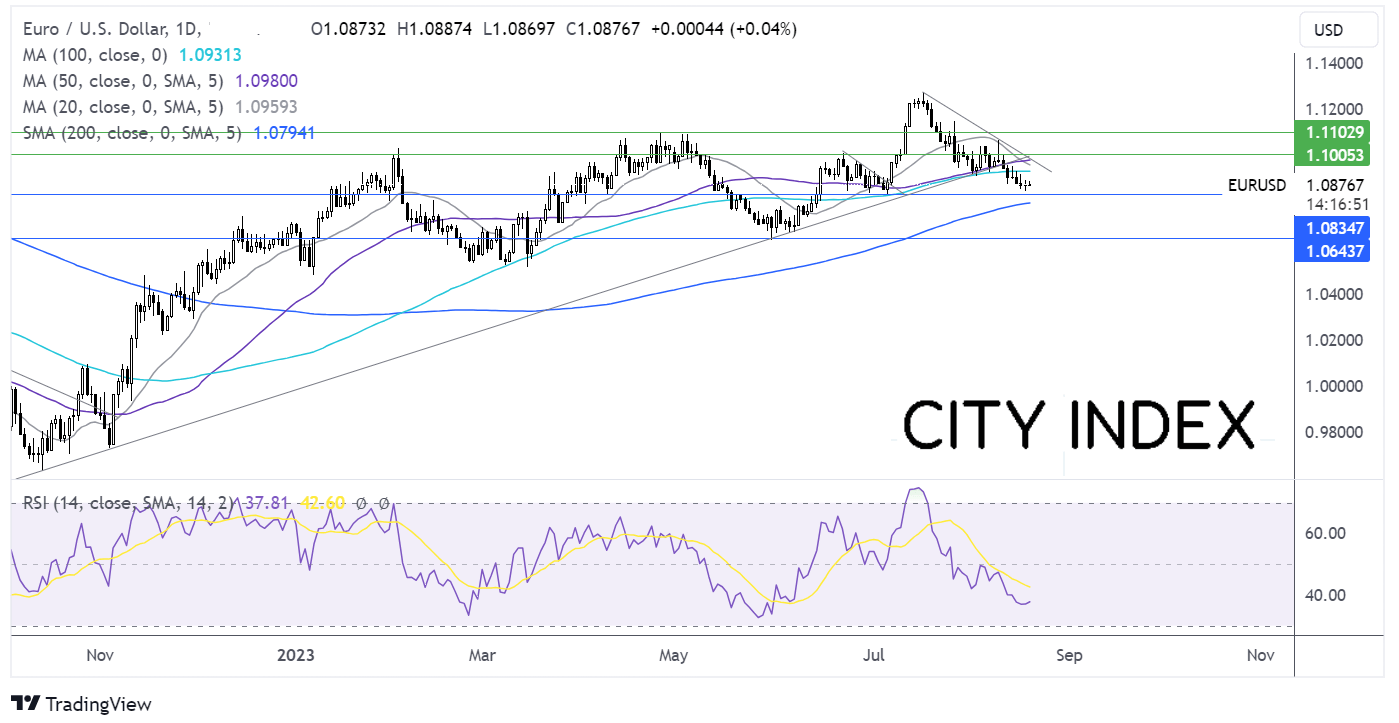
EURUSD trades below its falling trendline dating back to mid-July and has fallen below the multi-month rising trendline dating back to late last year. This, along with the bearish RSI keeps sellers optimistic of further downside.
The selloff has paused just above 1.0830, the July low, which acts as immediate support. A break below here exposes the 200 sma at 1.0794 ahead of 1.0630, the May low.
On the upside, buyers could look for a rise above 1.0930, the 100 sma, and 1.0960, last week’s high, ahead of 1.10 the psychological level.
Oil steadies after snapping a 7-week winning streak
- Oil prices fell last week amid concerns over China’s economy & US rates
- Tight supply amid Russia & Saudi Arabia cuts limit the downside
- Oil testing 20 sma resistance
Oil prices fell 2.3% last week, snapping a seven-week winning run.
More weak data from China last week, coupled with signs of weakness in the key property sector as real-estate developers such as Country Garden appear to be in the midst of a debt crisis.
Given that China is the world’s largest oil importer, signs of weakness in the economy is bad news for the oil demand outlook and oil bulls.
It is becoming increasingly clear that China’s economic issues are widespread and will require strong support from Chinese authorities, something which they are not appearing willing to provide.
Overnight the PBoC cuts the 1-year loan prime rate by 10 basis points to 3.45%, a move which has helped the energy markets edge high. However, the move was a smaller margin than hoped for, causing disappointment in the financial markets and sending Asian shares, including the Hang Seng, sharply lower so may not be the definitive answer that oil bulls are looking for.
Meanwhile, in the US, the world’s largest consumer of oil, expectations of high-interest rates for longer have also hurt the demand outlook. Meanwhile, the stronger dollar is also making oil more expensive for buyers with other currencies.
While the demand outlook is deteriorating, the downside is being limited by tight supply. OPEC+ have shown that they are serious about cutting supply to support the oil price. Deep production cuts by Saudi Arabia and Russia will be extended until at least the end of September, which is keeping a floor under oil prices.
Oil outlook – technical analysis
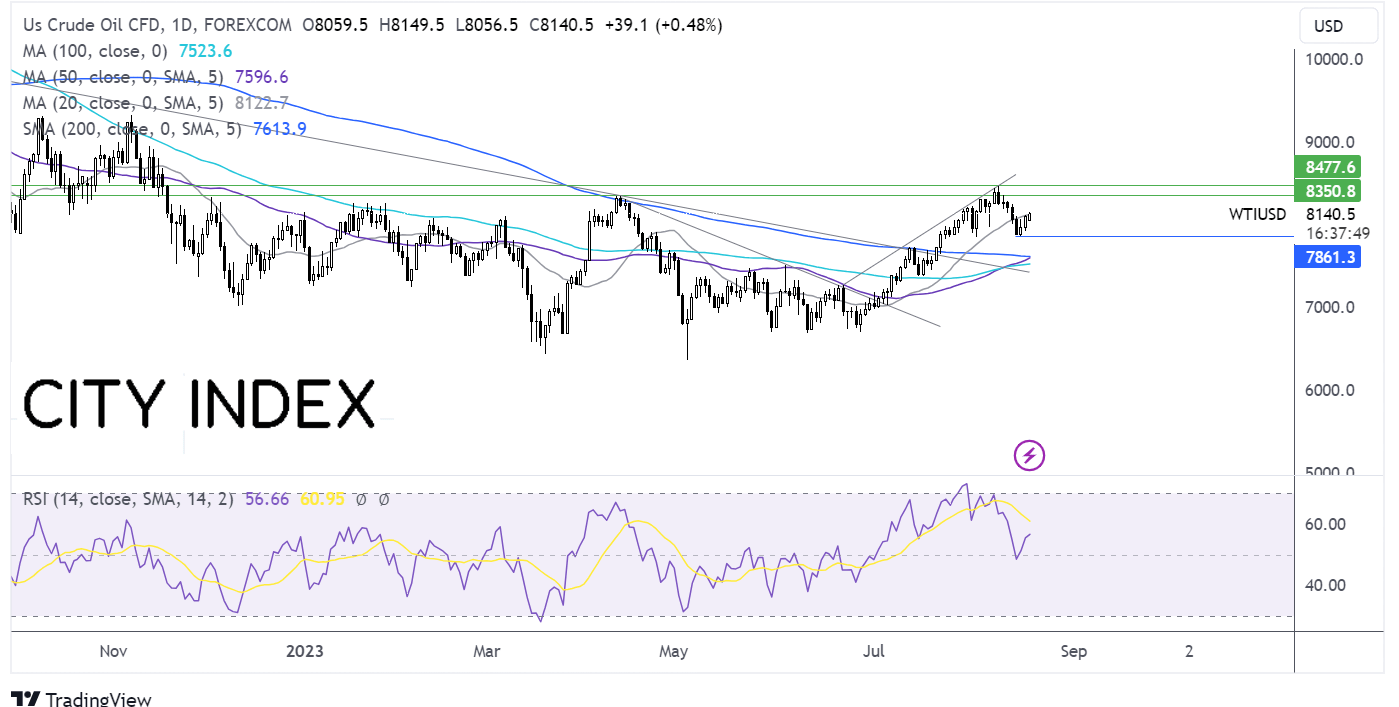
After finding support at 78.50 last week, oil is attempting to push back above the 20 sma at 81.20. A rise above here, combined with the RSI above 50 and a possible golden cross formation, with the 50 sma crossing above the 200 sma is encouraging for oil bulls.
A close above 81.20 could see oil look towards resistance at 83.50, the April high, ahead of 84.60 the August high.
Failure to push meaningfully above the 20 sma could see a retest of 78.50, with a break below here exposing the 200 sma at 76.15.
Latest market news
Yesterday 01:32 PM
Yesterday 09:35 AM
Yesterday 07:23 AM
Yesterday 04:48 AM
Yesterday 12:17 AM
July 25, 2024 10:39 PM
Latest EUR USD articles

July 15, 2024 11:40 AM

May 26, 2024 02:00 AM

May 9, 2024 10:15 PM

May 9, 2024 03:54 PM