


Can US inflation data make or break the US dollar? The Week Ahead
Whist the daily charts still appear favourable for another leg higher on the US dollar, the weekly charts and market positioning suggest some dark clouds may lurking above. Can incoming CPI data or inflation expectations make or break the dollar? If it leans enough in the right or wrong direction, it probably could.
The week that was:
- A relatively inflationary ISM services report saw traders scale back bets on multiple Fed rate cuts and bolster the US dollar, and Fed members continued to stick to a hawkish script and push back on any policy loosening
- Regardless, Wall Street hit record highs and the S&P 500 tapped 5,000 for the first time on record
- The BOC governor joined the chorus of central banks pushing back on rate cuts happening soon, citing the threat of persistent inflation as being a concern and that the BOC are not working towards a timetable for rate cuts
- The RBA held their cash rate at 4.35% for a third meeting, yet retained a tightening bias in their statement and noted that inflation remained “too high”.
- Crude oil prices soared over 3.4$ on Wednesday when Israel rejected a ceasefire proposal in Gaza, fanning fears of a Middle East conflict.
- The S&P 500 tapped 5,000 for the first time on record, although we go into Friday’s session questioning whether traders will have the appetite to push it higher ahead of the weekend or cash in their chips to trigger a potential pullback for the milestone l
- China consumer prices deflated at their fastest annual pace in 14 year at -0.8%. Whilst this points to sluggish growth, it also underscores the disinflationary pressures that could be heading over to the west.
The week ahead (calendar):
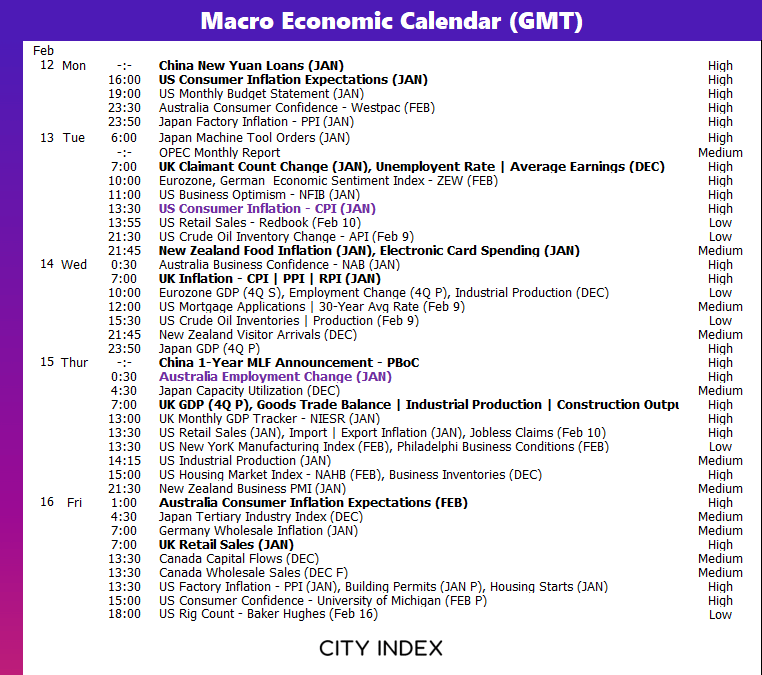
The week ahead (key events and themes):
- Chinese New year: public hols in China all next week, Singapore public holiday on Monday
- US CPI, inflation expectations: Hot figures from either data set could further strengthen the US dollar as it pushes back expectations for Fed cuts
- AU employment: We’re looking to see if December’s surprise -106k full-time jobs culling was a one-off or a new trend. If it’s the latter, AUD/USD could suffer as expectations RBA cuts get brought forward.
- UK data dump: CPI, GDP, trade balance, retail sales data could reshape BOE policy expectations
- NZ data: food inflation, credit card data and visitor arrivals data could be more relevant since ANZ revised their RBNZ OCR forecast for two 25bp hikes
US CPI, inflation expectations
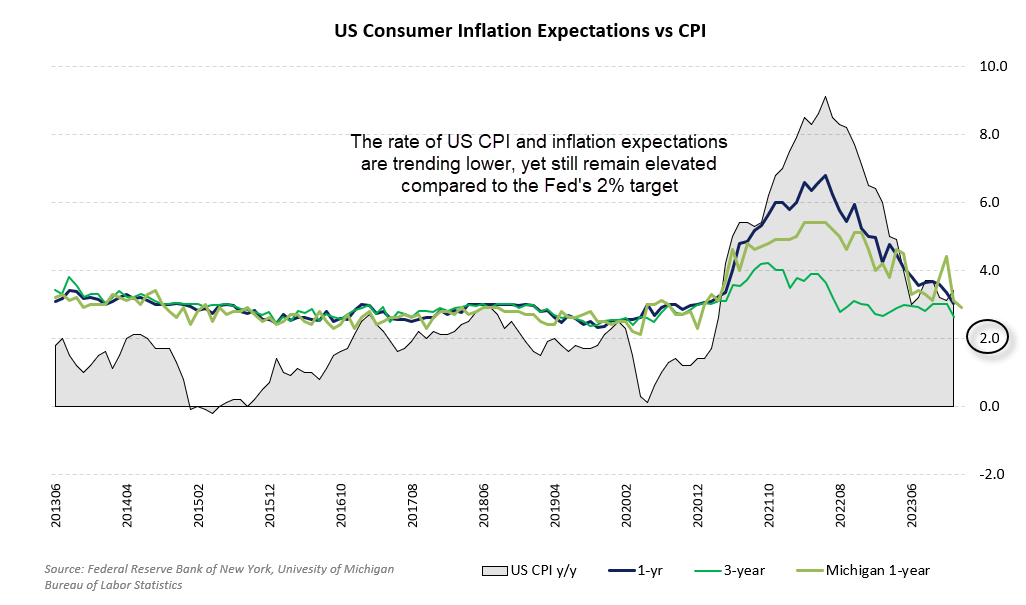
There are two key US inflation reports released for the US each month; consumer price indices (CPI) and personal consumption expenditure (PCE). The PCE report is generally considered to be the Fed’s preferred gauge as it is less volatile, but traders will keep a very close eye on CPI numbers – and they are released next week.
But a key input to CPI figures are inflation expectations, with one measure form the NY Fed being released on Monday. The chart below shows the NY Fed 1 and 3-year CPI expectations alongside the Michigan 1-year inflation expectations, and CPI y/y itself. A cursory glance shows that are all trending lower, and that has created a lot of excitement that the Fed may be cutting rates. The problem is that none of these metrics are near the Fed’s 2% inflation target. If consumer do not see CPI at 2% in 12 months from now, there’s a chance that CPI won’t be either.
If we find a surprise move higher for CPI expectations ahead of the CPI report, it could further bolster the US dollar and weigh on its peers as traders continue to scale back bets of a cut in H1. Conversely, a drop in CPI expectations could prompt the US dollar to retrace ahead of the CPI report and accelerate lower if inflation figures as come in softer than expected.
Trader’s watchlist: EURUSD, USD/JPY, WTI Crude Oil, Gold, S&P 500, Nasdaq 100, Dow Jones
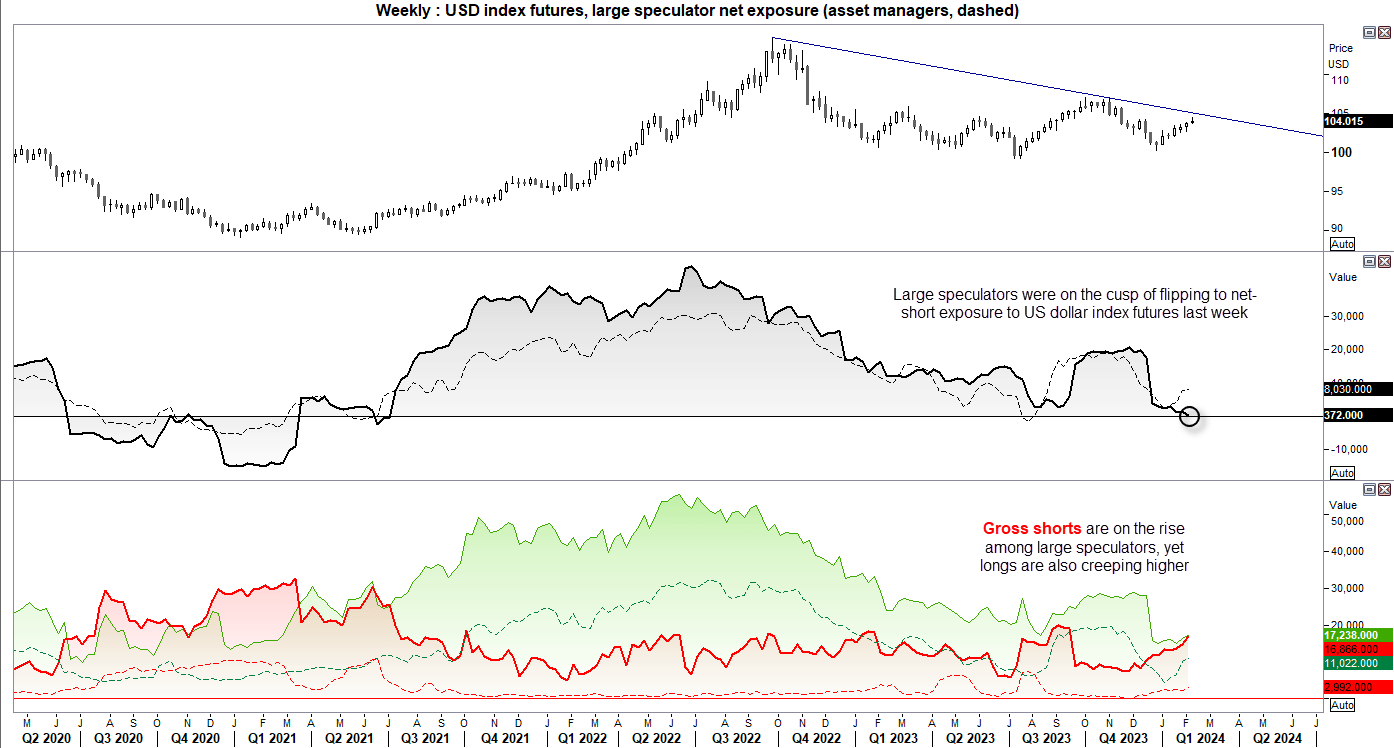
US dollar index technical analysis, market positioning (weekly chart):
Regular readers of mine will know that I have been bullish on the US dollar this year, and see the potential for it to move higher still on the daily chart. However, a few things stand out on the weekly chart of the US dollar index
- Potential resistance from the 2022 high
- Large speculators were on the cusp of flipping to net-short exposure on DXY futures last week
- The dollar’s YTD rally is closing in on trend resistance from the 2022 high
- We’ve close to a 6th week of gains without a real correction on the US dollar
- Upside could be limited from here (even though it could still rise form here)
- Caveat: asset managers remain firmly net-long US dollar index and shorts remain flat, not rising like large specs.
Whilst this does not mean the US dollar cannot go higher over the next days or even weeks, it does suggest its upside potential may be limited. As always, I will reassess as the data comes in, but if we’re treated to lower inflation expectations and CPI figures next week, it could mark a likely swing high on the US dollar.
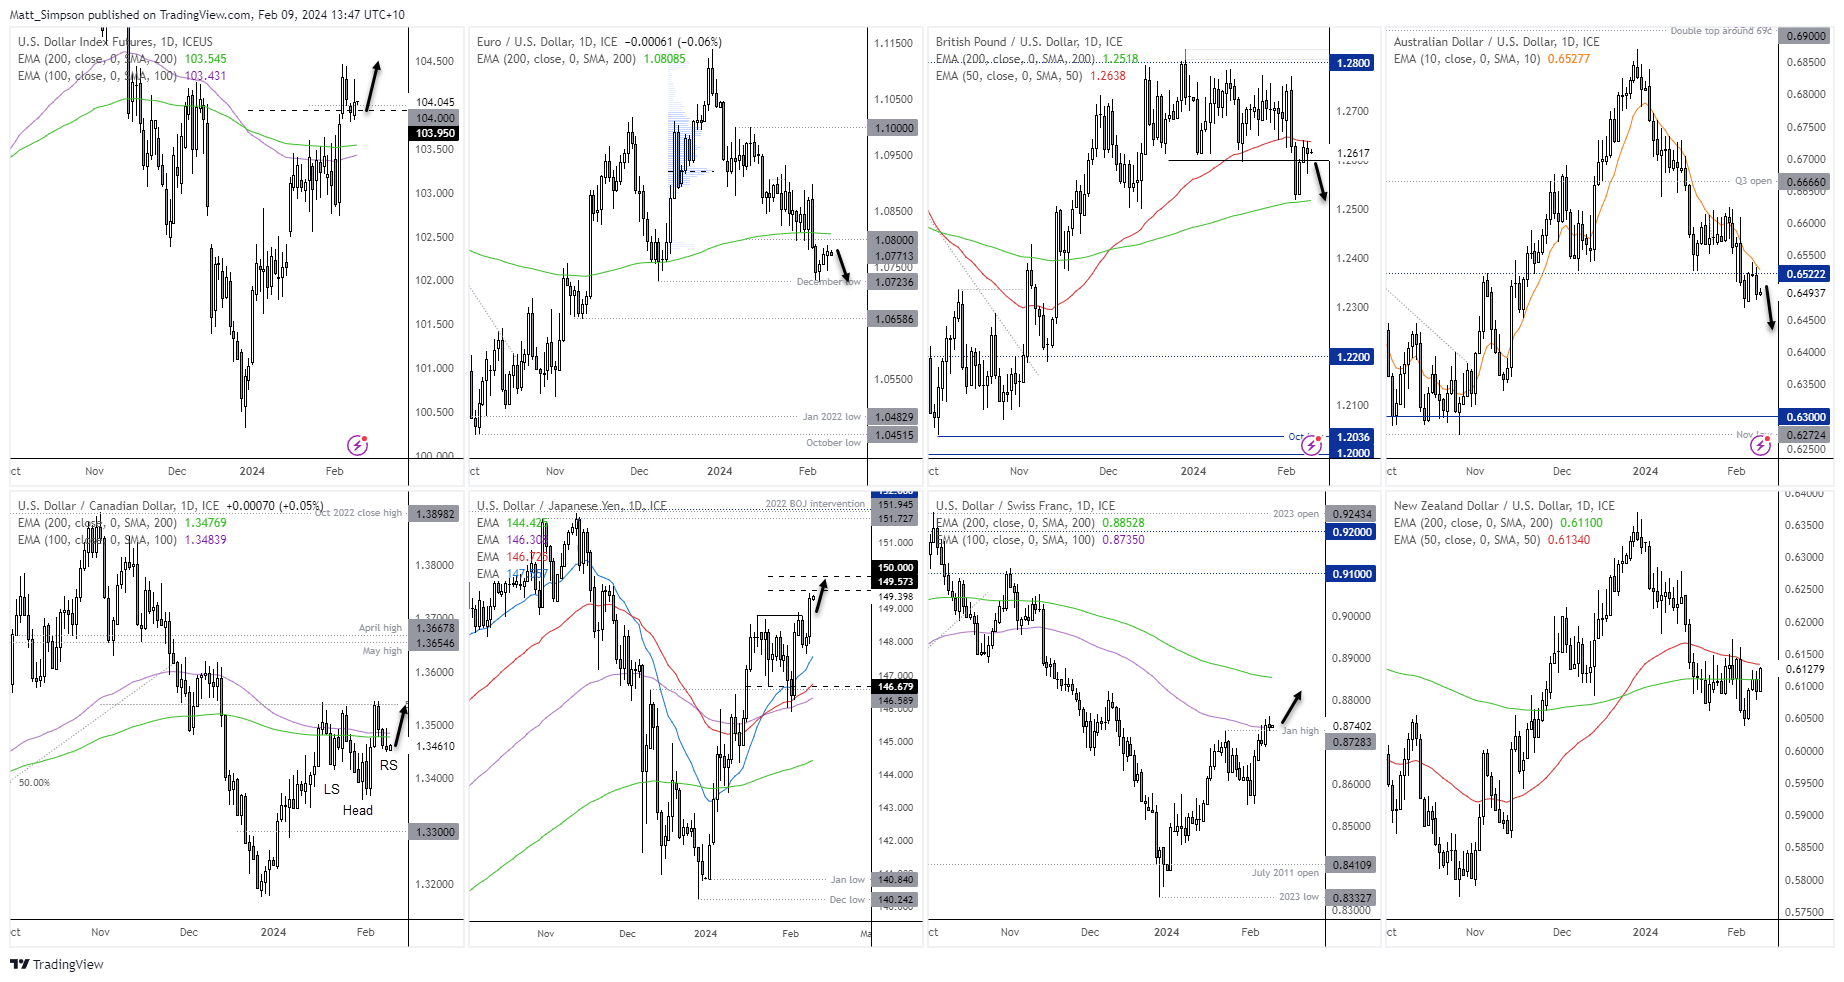
Daily chart: US dollar index (DXY), EUR/USD, GBP/USD, AUD/USD, USD/CAD, USD/JPY, USD/CHF, NZD/USD
Heading into the weekend, the US dollar looks like its retracement lower is losing momentum and that leaves the potential for another pop higher. Some observations of the FX majors charts include:
- The US dollar index (DX) formed a wide-legged inverted hammer, which also engulfed Wednesday’s range to hint at a swing low
- EUR/USD has posted a relatively friendly 3-day retracement against a not-so-friendly selloff into the December lows, to hint at a potential swing high
- GBP/USD formed a potential hanging man candle below the 50-day EMA, to suggest its rally from the 200-day EMA has lost steam. Although it is less appealing being caught between the 50/200-day EMAs.
- AUD/USD has rolled over from the 10-day EMA and looks set to retest the week’s low, which keeps the bias for a bear-flag breakout and move down to 64c alive
- NZD/USD was also hinting at another leg lower when it traded beneath the 200-day EMA, but headlines of ANZ forecasting two more RBNZ hikes have put this pair on the backburner
- USD/CAD printed an inverted hammer to suggest the pullback from its ‘triple top’ has lost momentum, and it can rally from here and break above the triple top an inverted head and shoulders pattern has formed (which can be a continuation pattern during an uptrend)
- The bias for USD/JPY to rise to 150 remains in play, with the potential for it to break higher given the BOJ’s ultra-dovish policy and the Fed’s pushback on rate cuts (a hot CPI print could make it the more exciting)
- USD/CHF may have formed a small shooting star candle, but a similar candle was engulfed on Tuesday, it has closed above the Jan high and the SNB are making noises about no longer wanting a stronger Swiss franc.
-- Written by Matt Simpson
Follow Matt on Twitter @cLeverEdge
How to trade with City Index
You can trade with City Index by following these four easy steps:
-
Open an account, or log in if you’re already a customer
• Open an account in the UK
• Open an account in Australia
• Open an account in Singapore
- Search for the market you want to trade in our award-winning platform
- Choose your position and size, and your stop and limit levels
- Place the trade
Latest market news
Yesterday 01:32 PM
Yesterday 09:35 AM
Yesterday 07:23 AM
Yesterday 04:48 AM
Yesterday 12:17 AM
July 25, 2024 10:39 PM
Latest Week ahead articles

Yesterday 04:48 AM

July 19, 2024 06:20 AM

July 12, 2024 01:32 AM
July 12, 2024 01:32 AM