
Short-term technical outlook on Gold (futures) (Fri 28 Jun)
click to enlarge charts
Key elements
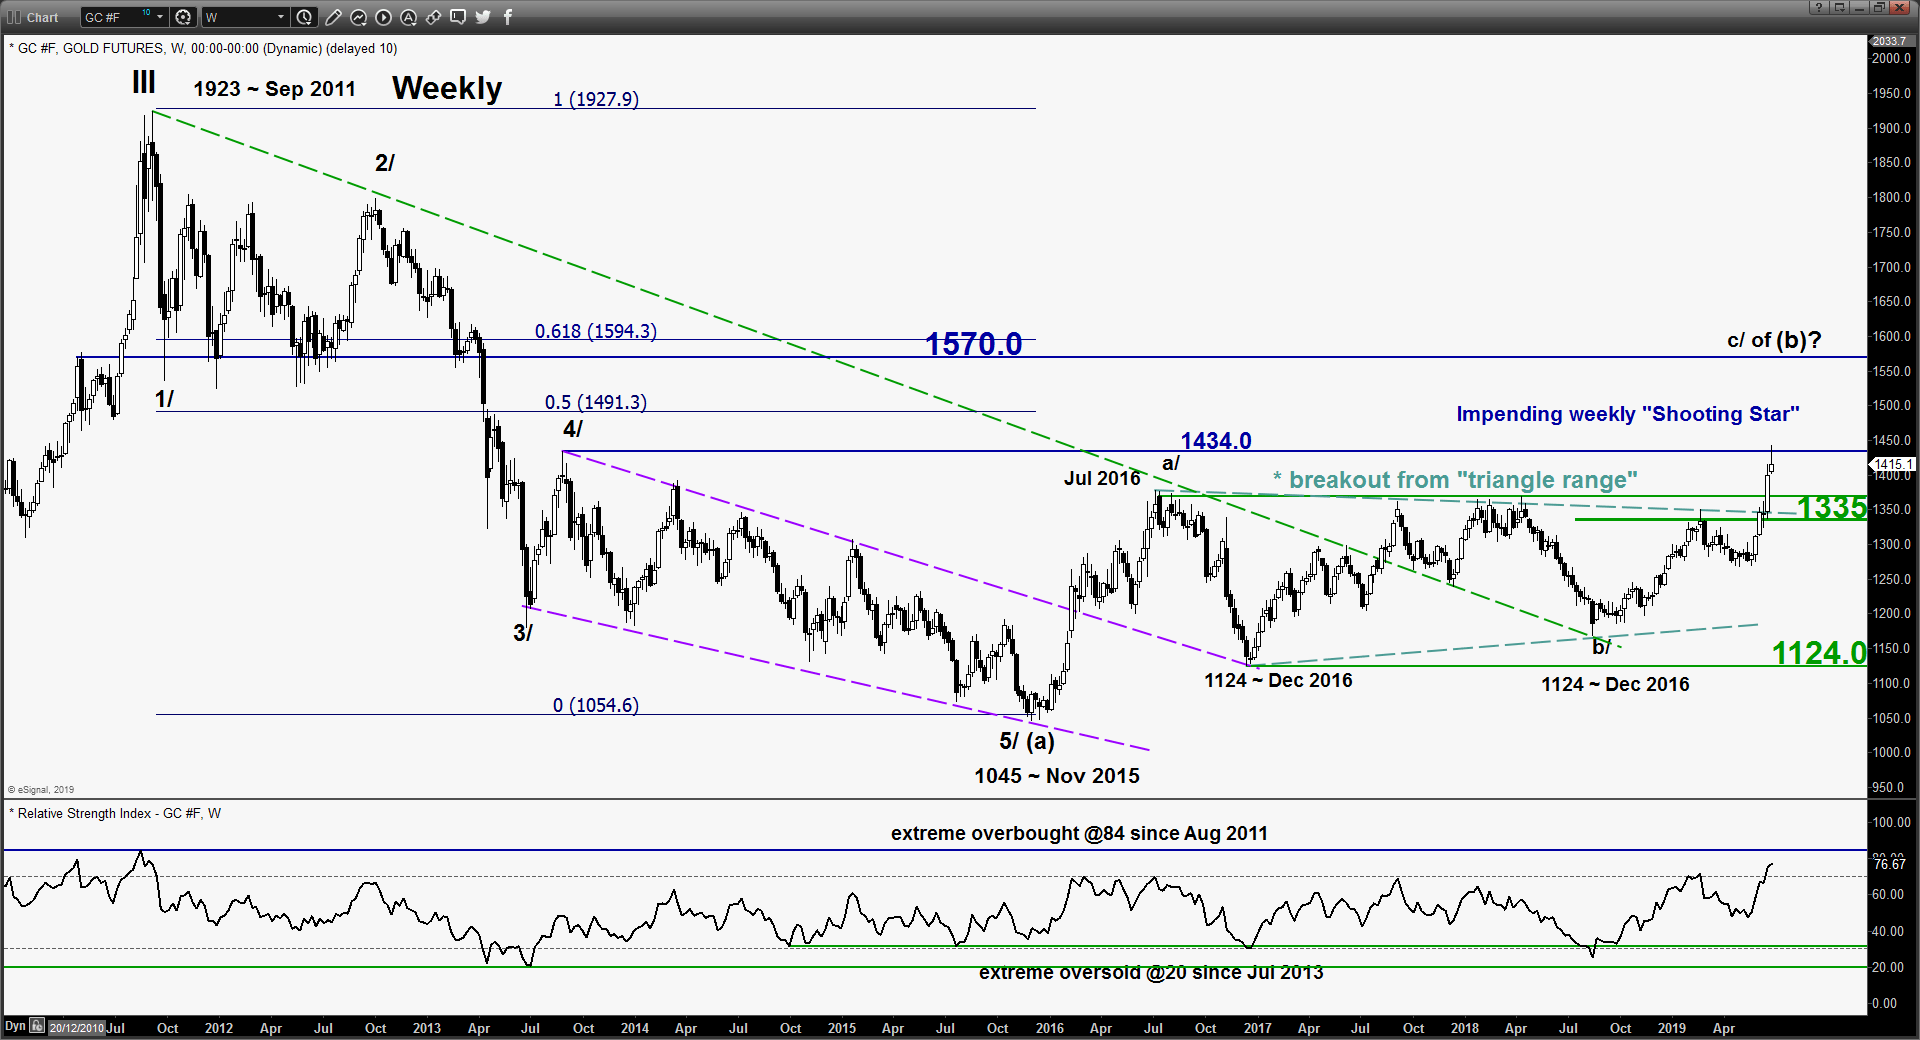
- The recent 3-month of 14%+ rally of Gold (futures) from its 1267.9 swing low of 22 Apr 2019 has reached a key medium-term resistance at 1434/43 (see weekly chart).
- Also, it is now forming an impending weekly bearish “Shooting Star” candlestick pattern right at 1434.
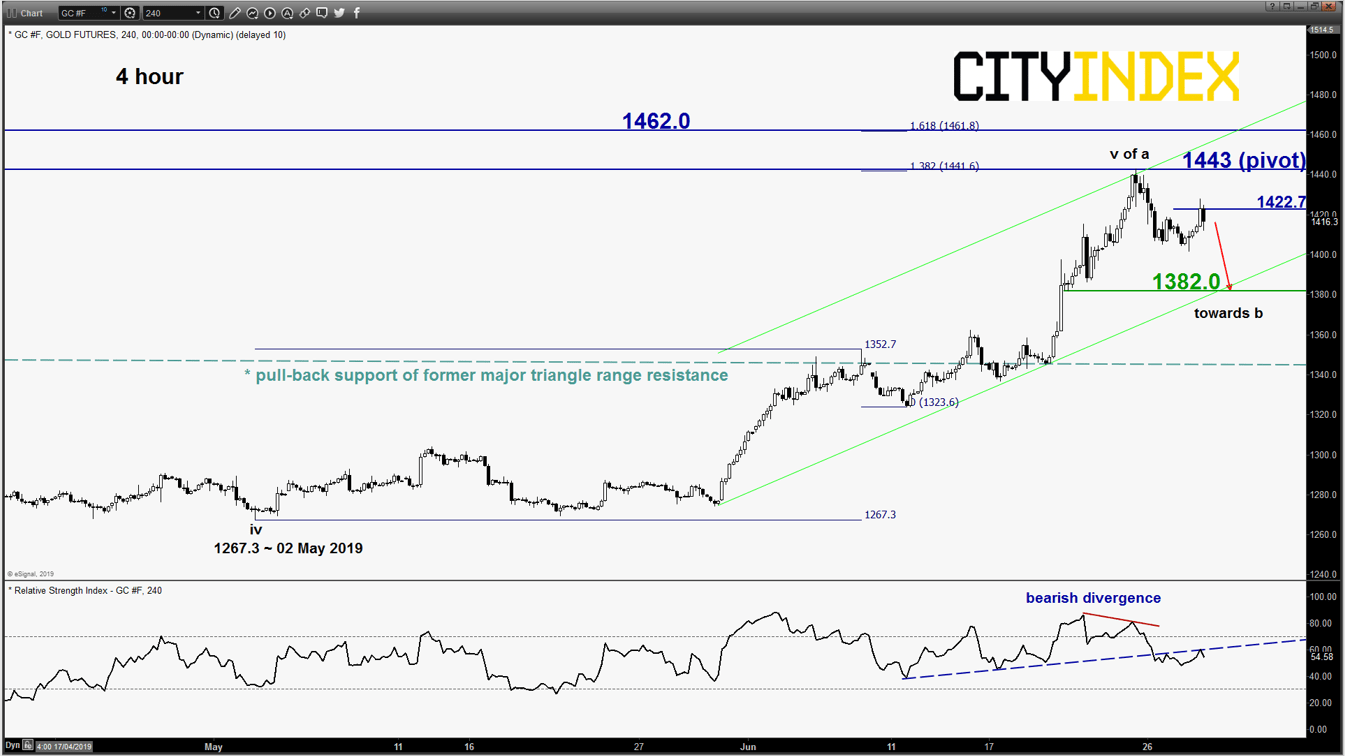
- In the shorter-term time frame, upside momentum has started to wane as the 4-hour RSI oscillator has staged a breakdown below a significant corresponding support at the 55 level after a prior bearish divergence signal at its overbought region (see 4-hour chart)
- The next significant short-term support rests at 1382.0 which is defined by the lower boundary of the minor ascending channel and the 38.2% Fibonacci retracement of the rally from 02 May low to 25 Jun 2019 high.
Key Levels (1 to 3 days)
Intermediate resistance: 1422.7
Pivot (key resistance): 1443.0
Support: 1382.0
Next resistance: 1462.0
Conclusion
If the key pivotal resistance at 1443.00 is not surpassed, Gold (futures) is likely to shape a potential corrective decline to target the next support at 1382.0 in the first step.
However, a clearance above 1443.00 invalidates the short-term bearish scenario to continue its parabolic climb towards the next resistance at 1462.0
Latest market news
Yesterday 01:03 PM
Yesterday 12:52 PM
Yesterday 12:11 PM
Yesterday 07:49 AM
Latest Commodities articles

April 29, 2024 11:05 AM

April 29, 2024 04:03 AM

April 28, 2024 11:57 PM

April 22, 2024 03:42 AM