

- Gold analysis: Metal remains fundamentally supported
- Week’s macro highlights include FOMC policy decision, NFP and ISM PMIs
- Gold technical analysis shows prices respecting the 21-day exponential

Gold prices have bounced back in the first half of Monday’s session after last week’s drop, when investors finally reacted to the recent strength of the US dollar and reduced expectations for Federal Reserve rate cuts on the back of more evidence of sticky inflation. In truth, traders were looking for any excuse to book some profit. But after the recent consolidation and minor pullback in gold prices, could we see a renewed rally this week?
Gold analysis video and insights on silver
Gold analysis: Investors eye key US data
As we enter this week, the spotlight is on key US macroeconomic indicators that could potentially influence the short-term trajectory of US dollar, and to some degree, precious metals. We have the FOMC policy decision to look forward to in mid-week, followed by the monthly jobs report on Friday and several other releases throughout the week including the ISM PMI data.
Let’s see whether the trend of soft survey data and strong hard data continues this week. Another question is whether gold investors will pay much attention to US data. After all, gold has largely been ignoring the strength in US dollar and bond yields for much of this year, so why not again this week? Indeed, the upward trend could persist for gold thanks to factors such as ongoing central bank gold acquisitions and the metals' role as an inflation hedge. Amid years of inflation surpassing expectations, fiat currencies have significantly depreciated, leading many investors to regard precious metals as reliable safeguards against rising price levels.
Gold analysis: Metal remains fundamentally supported
Although the possibility of a more significant correction is there, gold remains fundamentally supported. As mentioned, this is mainly because years of persistent inflation has eroded the value of fiat currencies, making hard assets that are limited in supply like gold and silver and some virtual currencies that are decentralised, which means that central banks do not control them, valuable in this regard. With regards to gold, proponents are also pointing to the fact it has been very resilience against a strong dollar and escalating bond yields, factors that in the past had kept it under pressure. This must be a bullish sign. With many investors who missed the recent surge in gold and silver prices, they would now be eyeing opportunities to potentially buy the dips given that prices are no longer excessively inflated from a technical viewpoint. This could be another factor supporting prices
Gold technical analysis
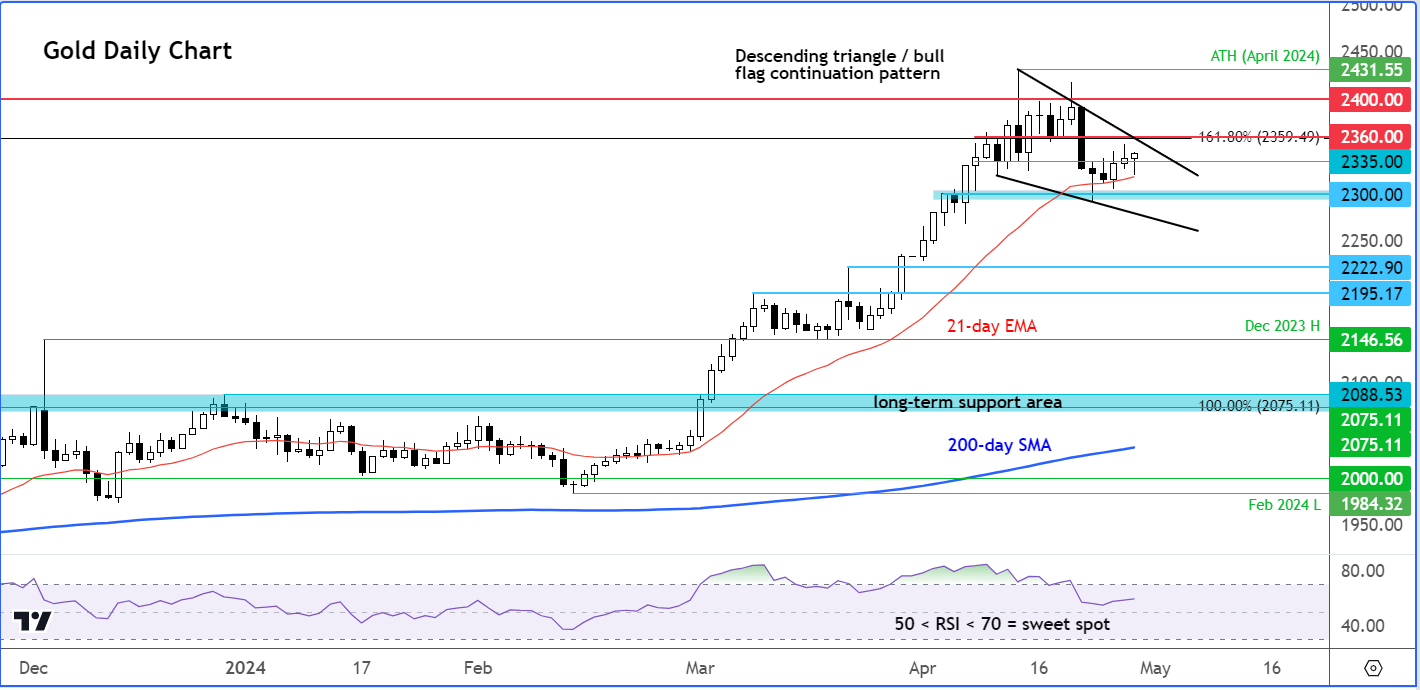
Source: TradingView.com
In the last few days, we have seen the gold chart starting to show some signs of bullishness again. It has so far held above the technically-important 21-day exponential moving average on a daily closing basis, finding good support from the $2300 levels. So far, we haven’t seen a decisive move higher, but do watch out for further bullish signals to emerge around these levels. Even if we don’t see a decisive move higher this week, an alternative sign of strength would be if we see prices continue to consolidate inside a bullish continuation pattern like a bull flag or a descending triangle.
In terms of levels to watch, support-term support comes in around $2330/5, followed by $2300. However, if gold were to break below $2300, then the bulls will need to wait for a confirmed reversal signal as that would point to a loss of bullish momentum. Even so, there will be lots of further support levels to watch should prices stage a deeper retracement. The next significant support level comes in around the $2222 area.
On the upside, $2360 is the next level of potential resistance, where the resistance trend of the triangle pattern and the long-term 161.8% Fibonacci extension level (derived from the 2020-2022 downswing) converge. Beyond this level, $2400 is the next potential resistance that could stand in the way to a new all-time high above this month’s peak of $2431.
-- Written by Fawad Razaqzada, Market Analyst
Follow Fawad on Twitter @Trader_F_R
How to trade with City Index
You can trade with City Index by following these four easy steps:
-
Open an account, or log in if you’re already a customer
• Open an account in the UK
• Open an account in Australia
• Open an account in Singapore
- Search for the company you want to trade in our award-winning platform
- Choose your position and size, and your stop and limit levels
- Place the trade
Latest market news
Yesterday 01:32 PM
Yesterday 09:35 AM
Yesterday 07:23 AM
Yesterday 04:48 AM
Yesterday 12:17 AM
July 25, 2024 10:39 PM
Latest Gold articles

July 22, 2024 02:47 AM

July 15, 2024 01:00 AM

July 9, 2024 02:32 AM

July 4, 2024 02:30 PM