


As traders trickle back to their desks to start another year, there’s one market move dwarfing all others: The US dollar is trouncing its major rivals. The chart below highlights the move, with the so-called commodity dollars (the Canadian, New Zealand, and Australian dollar) bearing the brunt of the selling (for more on USD/CAD, see my colleague Joe Perry’s Currency Pair of the Week article):
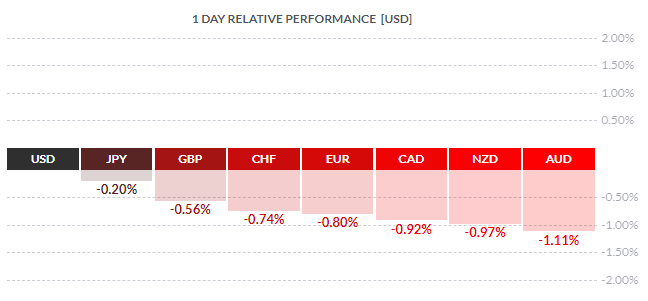
Source: FinViz
So what’s driving the big move in the greenback?
As always, one of the strongest cross-market correlations is between short-term interest rates and currencies. As the chart below shows, the 2-year US Treasury yield is trading up 5bps already today to its highest level since the start of the pandemic 22 months ago:
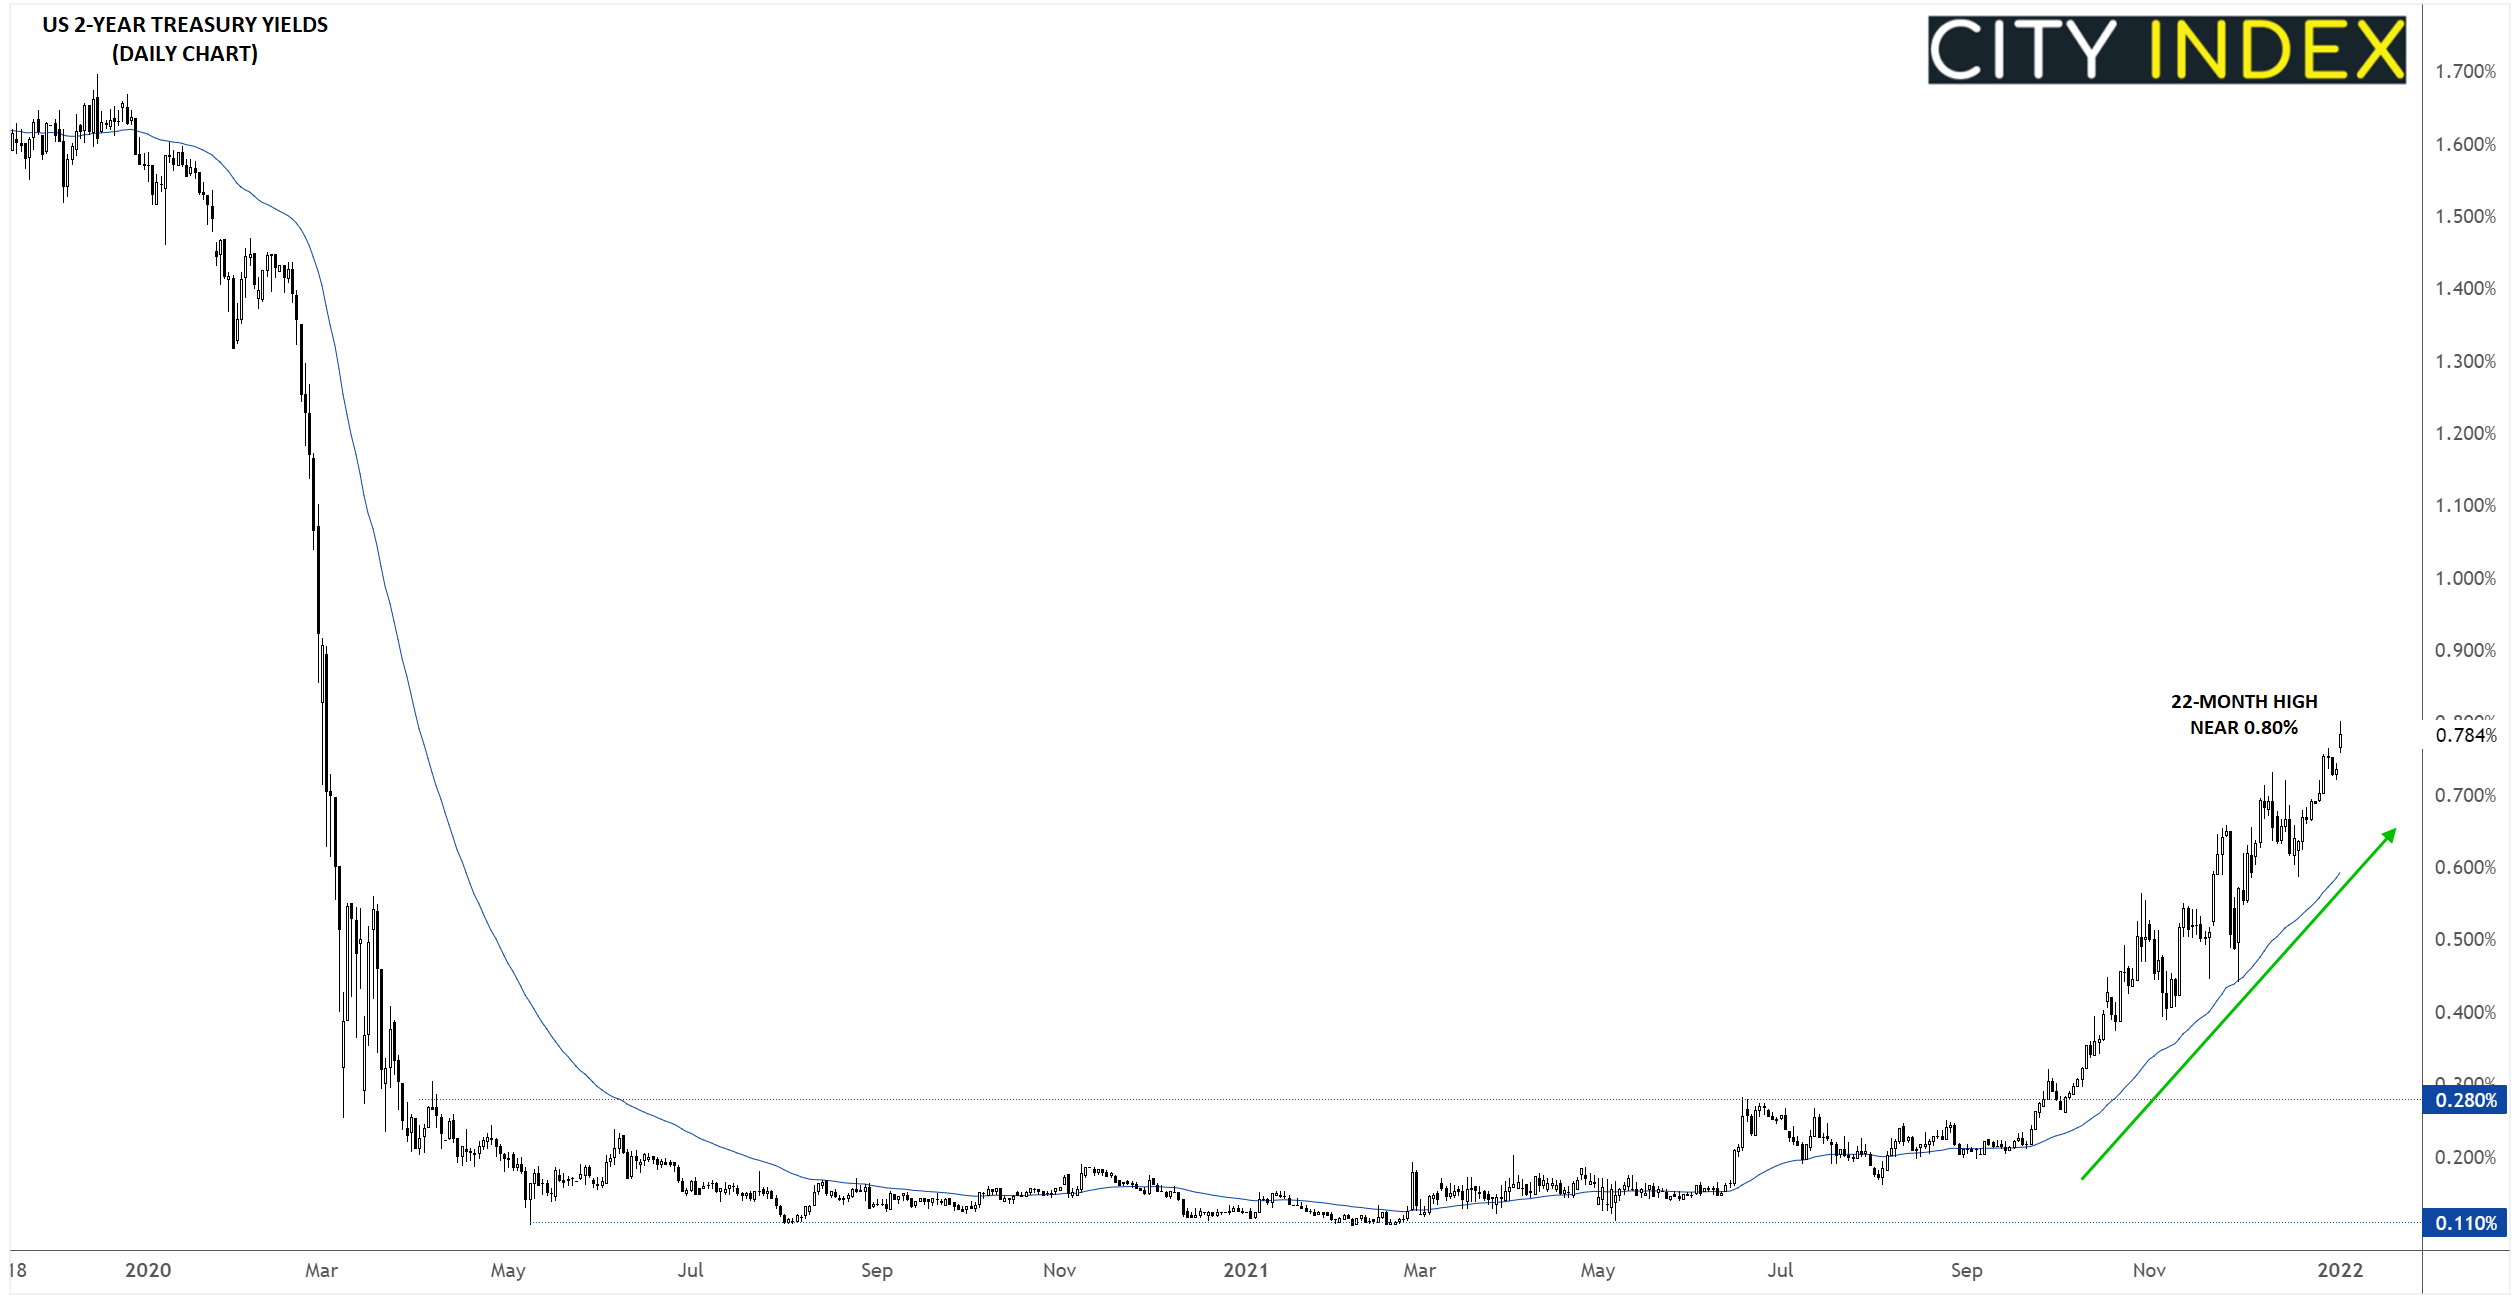
Source: Tradingview, StoneX
While we haven’t necessarily gotten any new “news” on the outlook for interest rates, it’s clear that investors are more confident than ever that the Federal Reserve will seek to “normalize” monetary policy in 2022. As a reminder, the median Fed voter has indicated that he/she expects 3 interest rate hikes this year, and two-thirds (12/18) of members anticipate at least that many rate increases.
On that note, the economic calendar will be ramping up throughout the next couple of weeks, with both traders and policymakers keen for the latest ISM surveys (Manufacturing tomorrow and Services on Thursday), readings on the labor market (ADP on Wednesday and NFP on Friday), inflation figures (CPI next Wednesday and PPI next Thursday), and retail sales (next Friday) out of the US.
Technical view: US Dollar Index (DXY)
The widely-followed US dollar index has spent the last seven weeks consolidating in a sideways range between roughly 95.50 and 97.00. After drifting down to the bottom of that range in low-liquidity holiday trade last week, buyers have stepped in aggressively to defend support near 95.50 to start this week; the rising 50-day EMA also comes in around that area, creating a confluence of support levels within the longer-term uptrend.
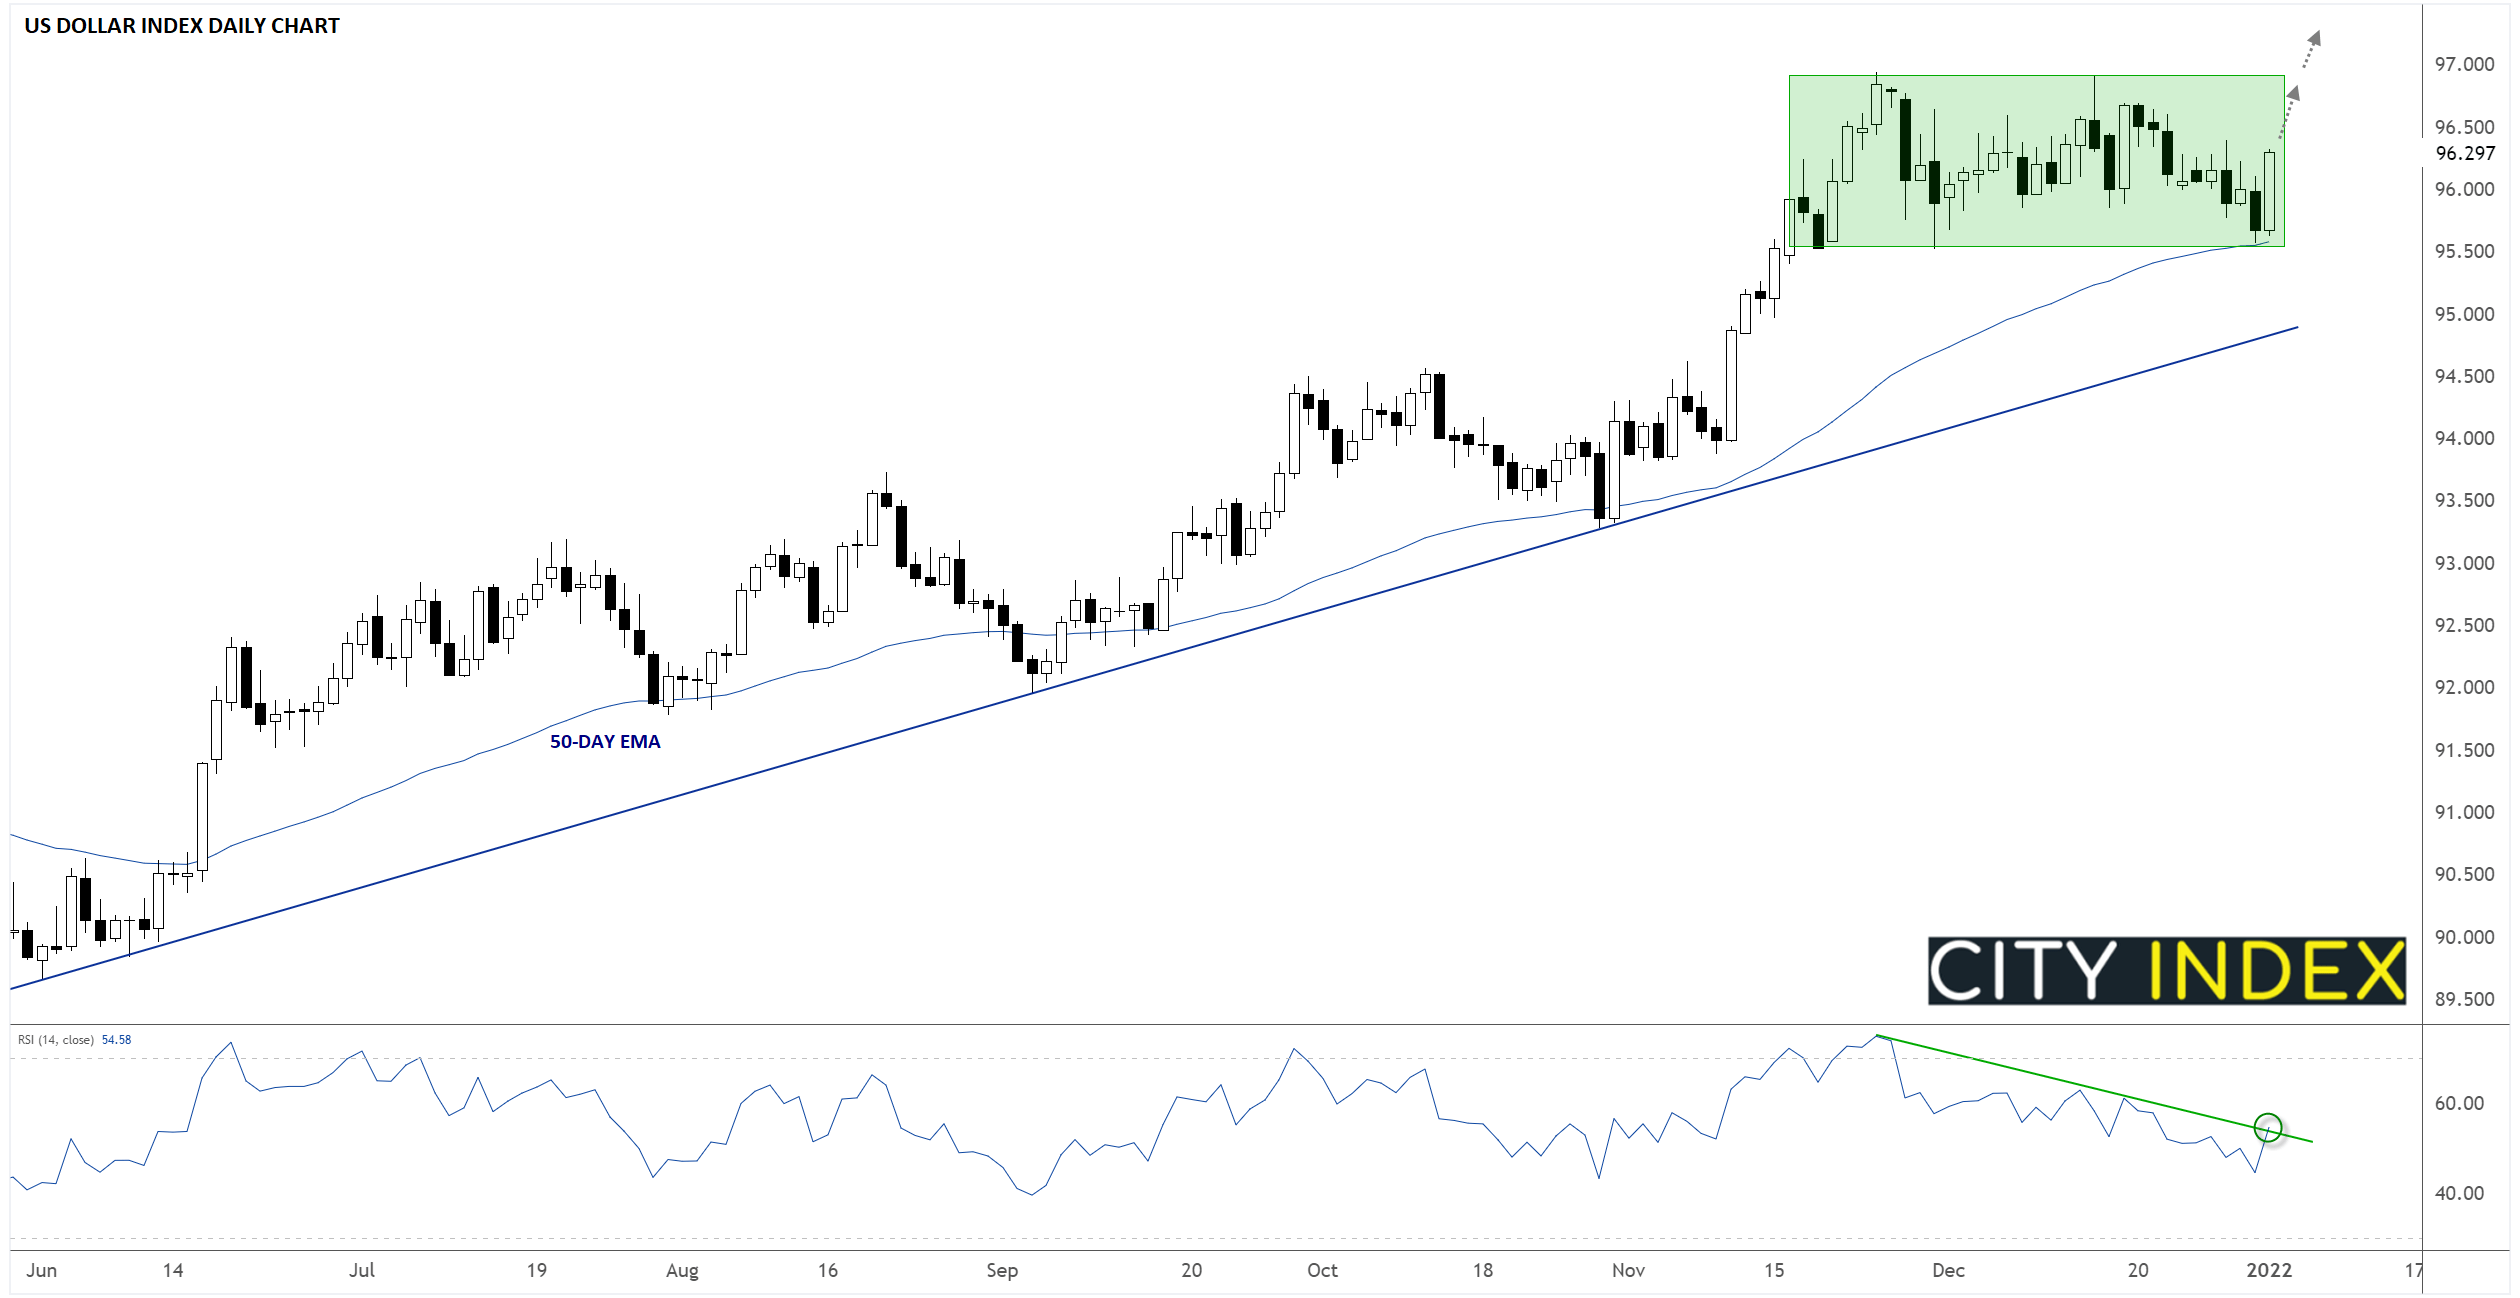
Source: Tradingview, StoneX
Looking ahead, continued rising yields could take the US dollar index back to its 18-month highs near 97.00, with a breakout above that level opening the door for more strength through the first half of the year. Meanwhile, only a breakdown from the recent range and the rising trend line near 95.00 would erase the medium-term bullish outlook for the US dollar index.
How to trade with City Index
You can trade with City Index by following these four easy steps:
-
Open an account, or log in if you’re already a customer
• Open an account in the UK
• Open an account in Australia
• Open an account in Singapore
- Search for the company you want to trade in our award-winning platform
- Choose your position and size, and your stop and limit levels
- Place the trade
Latest market news
Yesterday 01:32 PM
Yesterday 09:35 AM
Yesterday 07:23 AM
Yesterday 04:48 AM
Yesterday 12:17 AM
July 25, 2024 10:39 PM
Latest DXY articles

July 22, 2024 09:30 AM

July 17, 2024 11:18 PM

July 15, 2024 11:20 PM

July 12, 2024 10:38 AM