


February 14, 2023 3:45 PM

US CPI for January was 6.4% YoY vs an expectation of 6.2% YoY and a December reading of 6.5% YoY. Although the print was higher than expected, it was the seventh straight monthly decline after peaking at 9.1% YoY in June 2022. January’s CPI print was also the lowest since October 2021. Remember that the Fed targets 2% inflation. In addition to the headline CPI, the Core CPI for January was 5.6% YoY vs an expectation of 5.5% YoY and a previous reading of 5.7% YoY. This was the fourth straight monthly decline since peaking in September 2022 at 6.6% YoY. It was also the lowest print since December 2021. A softer reading than the December should please the Fed, however it is over triple the target. Core PCE, which is the Fed’s preferred measure of inflation (however CPI is definitely looked at) isn’t due until February 24th and the Fed doesn’t meet again until March 22nd. This means that the Fed will have plenty more inflation data to look at (including February’s CPI) before it meets again. Markets are currently pricing in a 90% chance of a 25bps rate hike at the March FOMC meeting.
The US Dollar Index was extremely volatile upon the release of the data print, trading in a 15-minute range between 102.59 and 103.21. Since then, the volatility has continued with the DXY trading as high as 103.52 before pulling back into the daily range.
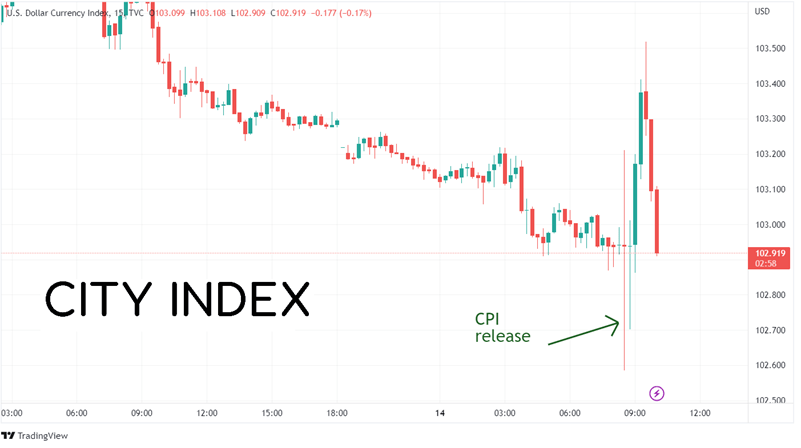
Source: Tradingview, Stone X
Trade the DXY now: Login or Open a new account!
• Open an account in the UK
• Open an account in Australia
• Open an account in Singapore
On a 240-minute timeframe, the DXY has been moving higher since making a near-term low on February 2nd at 100.82. The index retraced to the 61.8% Fibonacci retracement level from the highs of January 6th to the lows of February 2nd, near 103.79. It then pulled back in a pennant formation and broke out on February 10th. However, after the CPI data, price pulled back to re-test the top trendline of the pennant and the lows from February 9th, near 102.64. If price can move above recent highs at 103.96, the next level of resistance isn’t until the highs of January 6th at 105.63. This is also near the pennant target. However, if price moves below today’s range, the next support is the bottom trendline of the pennant near 102.25. Below there, horizontal support crosses at 101.55, then the February 2nd lows at 100.82.
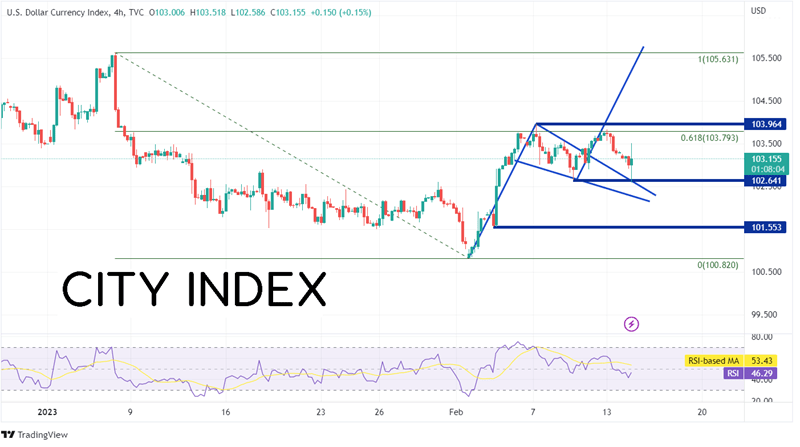
Source: Tradingview, Stone X
On a 240-minute timeframe for EUR/USD, price had been moving lower since making a near-term high on February 2nd at 1.1033. The pair pulled back just beyond the 61.8% Fibonacci retracement level from the lows of January 6th to the highs of February 2nd at 1.0655. Since then, EUR/USD rallied, and today the pair reached horizontal resistance and the 38.2% Fibonacci retracement level from the February 2nd highs to the February 13th lows near 1.0804. If EUR/USD continues to move higher, the next resistance level is the 50% retracement from the same timeframe at 1.0844, then horizontal resistance and the 61.8% Fibonacci retracement at 1.0888. However, if the pair breaks below today’s low of 1.0708, the first support is the lows from February 13th at 1.0655 and then horizontal support at 1.0635. Below there, price can fall all the way to the low of January 6th at 1.0482.
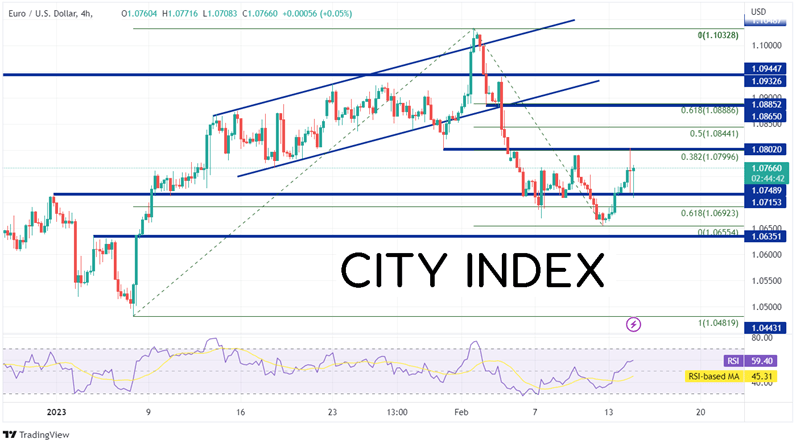
Source: Tradingview, Stone X
Trade EUR/USD now: Login or Open a new account!
• Open an account in the UK
• Open an account in Australia
• Open an account in Singapore
The January US CPI was stronger than expectations but weaker than December’s print. With the FOMC meeting not until March 22nd, the Fed will have plenty more inflation data to look at. Therefore, the US Dollar seems to be rangebound for the moment. However, keep an eye on the support and resistance levels. If price breaks above or below, the US Dollar and EUR/USD may have room to run.
Learn more about forex trading opportunities.
Latest market news
Yesterday 01:32 PM
Yesterday 09:35 AM
Yesterday 07:23 AM
Yesterday 04:48 AM
Yesterday 12:17 AM
July 25, 2024 10:39 PM
Latest Trade Ideas articles

Yesterday 09:35 AM

Yesterday 12:17 AM

July 25, 2024 10:39 PM

July 25, 2024 05:30 PM