


July 20, 2022 4:30 AM

The S&P500 closed 2.62% higher overnight, for its best session since June 24, rallying back to the 3950 level it brutally rejected in late June.
The S&P500’s overnight rebound was supported by apparent confirmation that gas supply to Europe via the Nord Stream 1 would soon resume. And better-than-expected U.S Q2 earnings reports that have (for now) eased concerns over an imminent slowdown.
Both followed the release of stronger than expected consumer sentiment and retail sales data viewed last Friday and a decline in consumer long-term inflation expectations.
Based on the high sensitivity of consumer inflation expectations to U.S retail gas prices, the recent retreat in average U.S retail gasoline prices (now below $4.50 a gallon after being as highs as $5.50 a month ago) may have played a part in the less hawkish than feared Fed speak last week.
What comes next?
This means the bear market can squeeze higher in the near term. However, beyond that, significant headwinds remain.
A slew of Q2 earnings reports will drop in the coming weeks, including the mega techs next week. Furthermore, many companies reporting are noting currency headwinds. According to Goldman Sachs, “In general, the math is 10% move higher in USD trade-weighted lowers the S&P500 EPS by 3%.”
Elsewhere, the Fed has not guided the market to a possible terminal rate, and inflation has accelerated higher, postponing calls for peak inflation.
Finally, the likely resumption of Russian gas supply to Europe this week does not mean the end of Europe’s energy crisis. Should Russian President Putin decide to turn European gas supplies off, it will most likely be in the colder months of Autumn to maximize its impact.
What do the charts say?
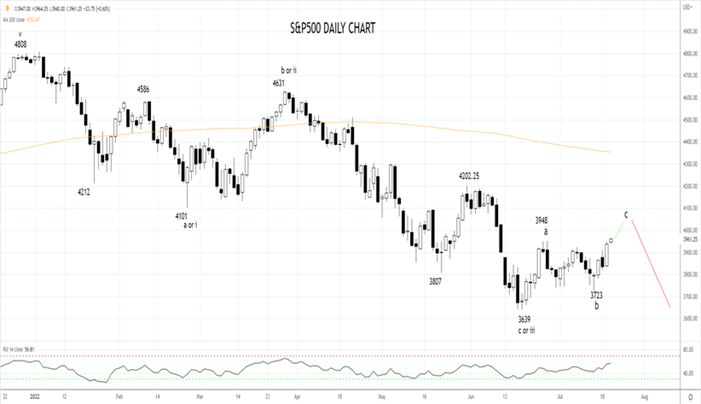
Back on June 22 here and again on June 30 here, we called for the S&P500 to undertake a bear market rally into the 4000/4100 resistance zone and this remains our base case. From within this resistance area, look for a turn lower in August, before a retest of the June 3639 low.
Only on a sustained close above resistance at 4200/20 would we become more open-minded that a tradable low is in place at the 3639 low and to the possibility of a stronger rally.
Source Tradingview. The figures stated are as of July 20 2022. Past performance is not a reliable indicator of future performance. This report does not contain and is not to be taken as containing any financial product advice or financial product recommendation
How to trade with City Index
You can trade with City Index by following these four easy steps:
-
Open an account, or log in if you’re already a customer
• Open an account in the UK
• Open an account in Australia
• Open an account in Singapore
- Search for the company you want to trade in our award-winning platform
- Choose your position and size, and your stop and limit levels
- Place the trade
Latest market news
Yesterday 01:32 PM
Yesterday 09:35 AM
Yesterday 07:23 AM
Yesterday 04:48 AM
Yesterday 12:17 AM
July 25, 2024 10:39 PM
Latest Wall Street articles

May 30, 2024 11:18 PM

May 29, 2024 10:59 PM

May 21, 2024 06:30 AM

October 31, 2023 01:06 PM