


June 22, 2022 3:56 AM

The S&P500 closed 2.33% higher overnight in its first session this week as the Juneteenth long weekend provided a circuit breaker, allowing investors to regroup after U.S equity markets plunged over 10% the past two weeks.
The overnight rally appears to have also been supported by the start of end of month, end of the quarter and end of financial year rebalancing flows.
The equities desk of a large U.S investment bank, has estimated that pension funds need to buy around $30 billion of equities based on the quarterly moves in bond and equity markets. An amount that while significant seems smaller than I would have guessed given the extraordinary moves viewed this quarter.
While rebalancing estimations should be treated with caution, particularly in this sort of market, if correct it should see stocks supported into the end of next week and possibly into early July as funds allocate money into the market at the start of the new financial year.
Stepping up to counter the growing chorus of recession calls from U.S business heavyweights, U.S President Biden said overnight that he does not think a recession in the U.S is inevitable.
Richmond Fed President Barkin noted similar, although he also said that he supported the decision to raise the Fed Funds rate by 75bp at the June FOMCV meeting and added “you want to go as fast as you can without breaking anything.”
The quote from Barkin above provides a reminder of the needle that the Fed is attempting to thread. While the Fed would like to tame inflation quickly there is a very high risk that it raises rates by too much and too quickly into slowing growth, and sends the U.S economy into recession.
What does it mean?
Presuming that the large rebalancing flows some are predicting do lift the S&P500 over the next fortnight, the rally should be viewed as bear market rally to be followed by a retest of last week’s lows.
Only a sustained move above resistance at 4200/20 would give reason to reconsider this view as it would break the neat sequence of lower highs and lower lows from the November bull market high.
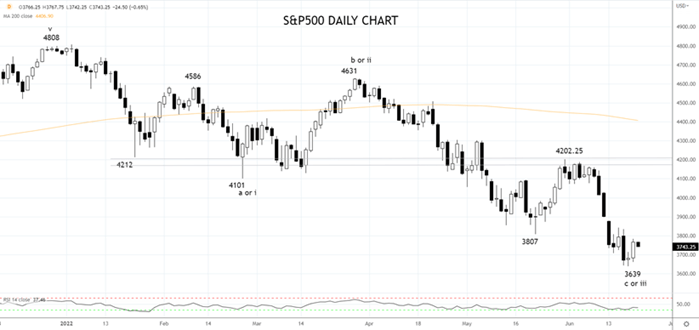
Source Tradingview. The figures stated are as of June 22ndt 2022. Past performance is not a reliable indicator of future performance. This report does not contain and is not to be taken as containing any financial product advice or financial product recommendation
How to trade with City Index
You can trade with City Index by following these four easy steps:
-
Open an account, or log in if you’re already a customer
• Open an account in the UK
• Open an account in Australia
• Open an account in Singapore
- Search for the company you want to trade in our award-winning platform
- Choose your position and size, and your stop and limit levels
- Place the trade
Latest market news
Yesterday 01:32 PM
Yesterday 09:35 AM
Yesterday 07:23 AM
Yesterday 04:48 AM
Yesterday 12:17 AM
July 25, 2024 10:39 PM
Latest Stocks articles

July 18, 2024 11:35 AM

June 13, 2024 02:00 PM

June 6, 2024 02:00 PM
June 2, 2024 08:00 AM