


- Gold technical analysis: weekly RSI above 75
- Gold may be unable to defy rising yields for too long
- US CPI coming up later in the week
Gold hits news record before easing back a tad
Over the weekend, there was no further escalation in the conflict between Iran and Israel, which meant there was a bit of relief in the sharp rallies we have observed in crude oil and gold prices in recent weeks. However, the precious metal's dip was swiftly bought during the Asian session, leading to another rise to a record high of over $2350, before it started to ease back lower. This was driven in part because of technical momentum, after the metal closed near the highs on the week on Friday. But following a big 9% rally last month and a further 5% or so this month, gold is now finding itself at extremely overbought levels. So, it is quite intriguing to see whether the metal can maintain these lofty levels, or will it stage an overdue correction now.
Gold may be unable to defy rising yields for too long
Gold investors appear to be turning a blind eye to the strength of US bond market and economic data, with Friday's robust US jobs report, boasting a headline figure of over 300K, couldn’t stop the metal from hitting a fresh record. Yet, with government debt yields on the rise, the opportunity cost of holding gold is increasing from a yields perspective, given the metal’s lack of interest-bearing attributes. Consequently, the risk of a correction is indeed on the rise. At some stage, investors will prefer to utilise their investment capital in opting for a fix guaranteed return than hoping to see further capital appreciation in gold.
Gold technical analysis: weekly RSI above 75
Undoubtedly, gold is looking rather overbought by almost any metric you employ.
Let’s start by looking at the weekly chart:
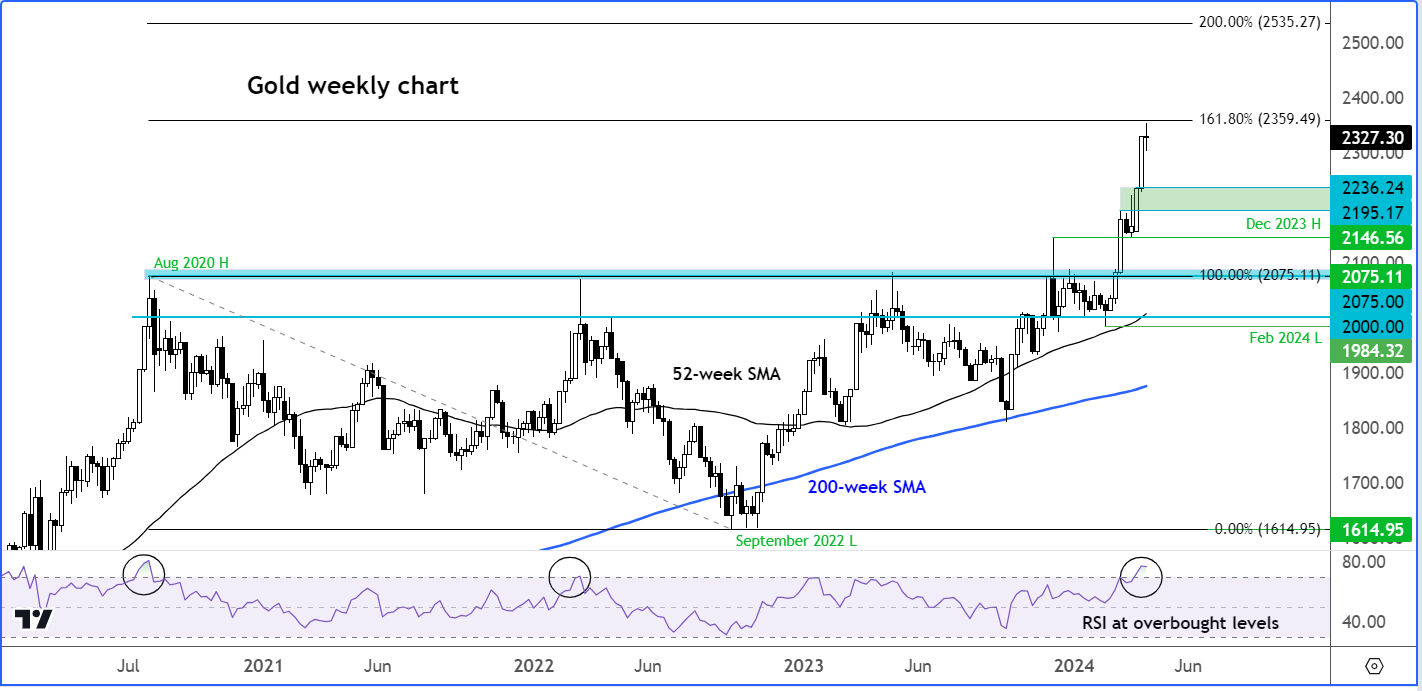
Gold is looking quite overbought on the weekly chart with the RSI rising above 75.00, which is an extremely overbought level. In previous occasions that gold had moved above the 70 threshold you can see that it was preceded by a sell off. While past price action is not necessarily an indicator of future performance, you can’t ignore the risk of gold heading at least a little lower from current levels and in light of a sharp two-week rally.
In addition to the RSI being in overbought territory, gold is also near the 161.8% Fibonacci extension level at $2359. This Fibonacci extension level is derived using the high of August 2020 and the September 2022 low.
A small pullback, if seen, will not necessarily be the end of the bullish trend. Indeed, people who have missed the opportunity to buy gold at lower levels will be looking to buy any dips that they may get their hands on to.
Gold technical analysis: Can gold dip back to trend support?
On the daily time frame, we can see price action in greater detail.
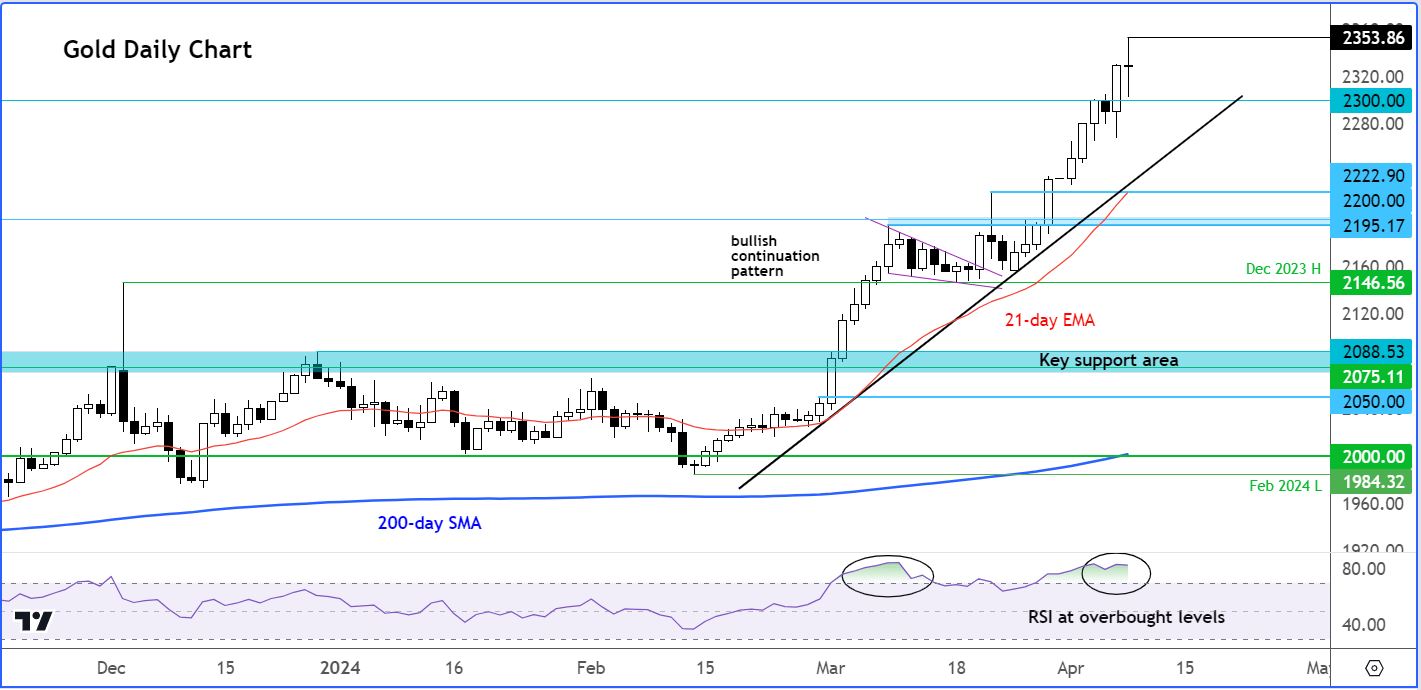
As seen from the sub-chart, the Relative Strength Index (RSI) is comfortably above the 70.0 threshold, suggesting we may witness some profit-taking or consolidation in the week ahead. The robust bullish trend means any substantial decline could find support. Short-term support is around $2300 now, followed by a more critical zone around $2222, and then the $2195/2200 area.
The $2222 area is also where the 21-day exponential moving average converges with the bullish trend line. Can we see a dip on XAUUSD to this level in the coming days?
The overbought conditions signalled by the RSI can be rectified through time, particularly if gold consolidates around current levels for a few days, without giving back too much ground, say past the $2222 level. This would be the optimal scenario for gold investors, considering the metal's rapid ascent in recent days.
Source for all charts used in this article: TradingView.com

-- Written by Fawad Razaqzada, Market Analyst
Follow Fawad on Twitter @Trader_F_R
How to trade with City Index
You can trade with City Index by following these four easy steps:
-
Open an account, or log in if you’re already a customer
• Open an account in the UK
• Open an account in Australia
• Open an account in Singapore
- Search for the company you want to trade in our award-winning platform
- Choose your position and size, and your stop and limit levels
- Place the trade
Latest market news
Yesterday 01:32 PM
Yesterday 09:35 AM
Yesterday 07:23 AM
Yesterday 04:48 AM
Yesterday 12:17 AM
July 25, 2024 10:39 PM
Latest Gold articles

July 22, 2024 02:47 AM

July 15, 2024 01:00 AM

July 9, 2024 02:32 AM

July 4, 2024 02:30 PM