


Gold technical forecast: XAU/USD weekly trade levels
- Gold prices reverse sharply off confluent technical support
- XAU/USD rally approaching first major test at yearly high-week close
- Gold resistance 1861, 1900, 1920s (key)– support 1787-1807 (key), 1746, 1676
Gold prices plummeted into technical support this week with XAU/USD poised to mark an outside-weekly reversal off fresh yearly lows. These are the updated targets and invalidation levels that matter on the XAU/USD weekly technical chart.
Discuss this gold setup and more in the Weekly Strategy Webinars on Monday’s at 8:30am EST.
Gold Price Chart – XAU/USD Weekly
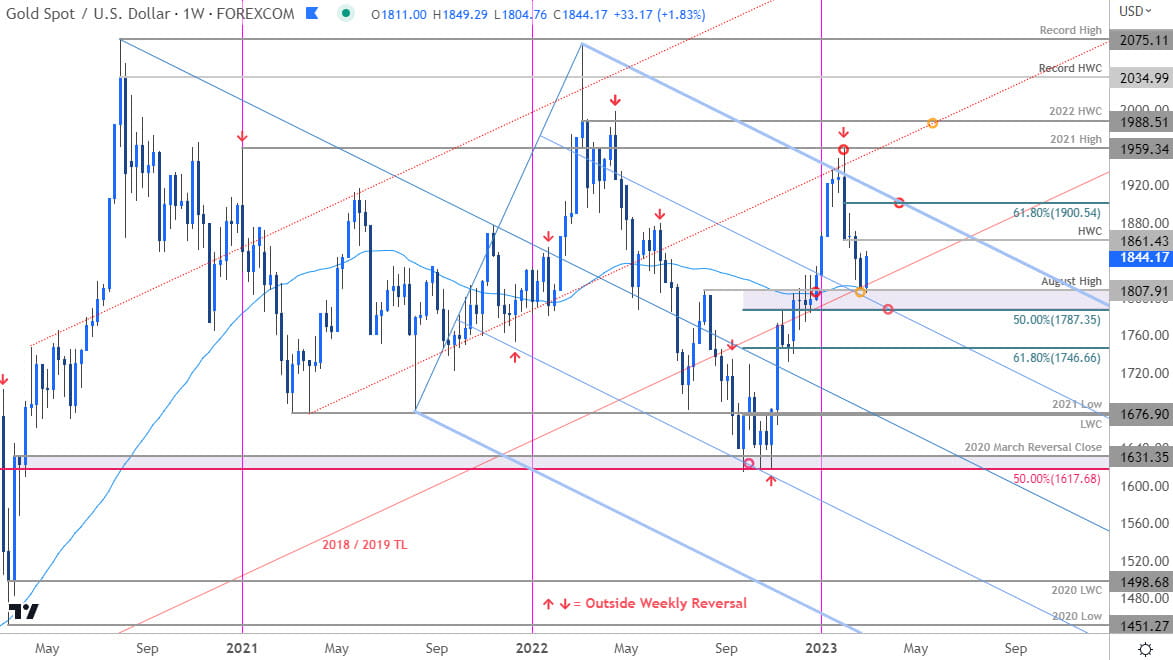
Chart Prepared by Michael Boutros, Technical Strategist; XAU/USD on TradingView
Technical Outlook: In last month’s Gold Weekly Price Forecast we highlighted a critical support zone at, “1807/28- a region defined by the August swing high, the 52-week moving average, the objective yearly open and the 38.2% retracement of the September advance... an area of interest for possible downside exhaustion / price inflection IF reached.” XAU/USD plunged into this zone with a decline of more than 7.8% off the yearly high reversing sharply off confluent support this week.
Time decay now shifts the focus to the 1787-1807 support zone- a region that now includes the 50% retracement and the 52-week moving average. We’re on the lookout for major price inflection off this zone.
Initial resistance now eyed at the yearly high-week reversal close at 1861 backed by the 61.8% Fibonacci retracement at 1900. Ultimately a breach / close above pitchfork resistance (currently near ~1920s) is needed to suggest a more significant low was registered this month.
A break lower from here would threaten resumption of the broader downtrend with such a scenario exposing initial weekly support at he 61.8% retracement of the September rally at 1746.
Bottom line: Gold has responded to a key pivot zone with prices poised to mark an outside-week reversal. From a trading standpoint, looking to validate a medium-term low while above 1787 with a breach / weekly close above the upper parallel ultimately needed to put the bulls back in control. Use caution on a break below this support zone with such a scenario likely to fuel an accelerated bout of losses- stay nimble here. Review my latest Gold short-term technical outlook for a closer look at the near-term technical trade levels.
Key Economic Data Releases
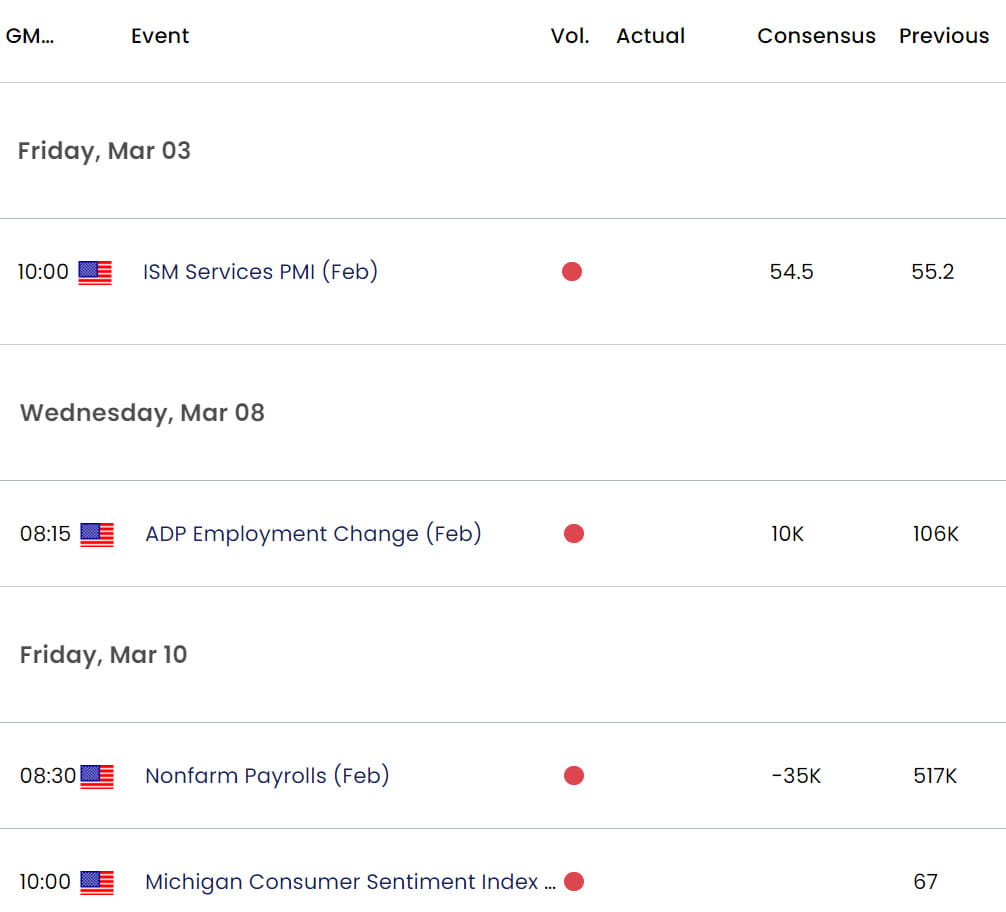
Economic Calendar - latest economic developments and upcoming event risk.
Active Weekly Technical Charts
- S&P 500 (SPX500)
- US Dollar Index (DXY)
- British Pound (GBP/USD)
- Australian Dollar (AUD/USD)
- Japanese Yen (USD/JPY)
- Canadian Dollar (USD/CAD)
- Euro (EUR/USD)
--- Written by Michael Boutros, Sr Technical Strategist with FOREX.com
Follow Michael on Twitter @MBForex
Latest market news
Yesterday 01:32 PM
Yesterday 09:35 AM
Yesterday 07:23 AM
Yesterday 04:48 AM
Yesterday 12:17 AM
July 25, 2024 10:39 PM
Latest Gold articles

July 22, 2024 02:47 AM

July 15, 2024 01:00 AM

July 9, 2024 02:32 AM

July 4, 2024 02:30 PM